
Linear Programming: Fixed to Grid & Label x&y Axis
Loading the math board and drawing, please wait…
In collections
Geom. & Alg.: Systems Equations & Linear Programming
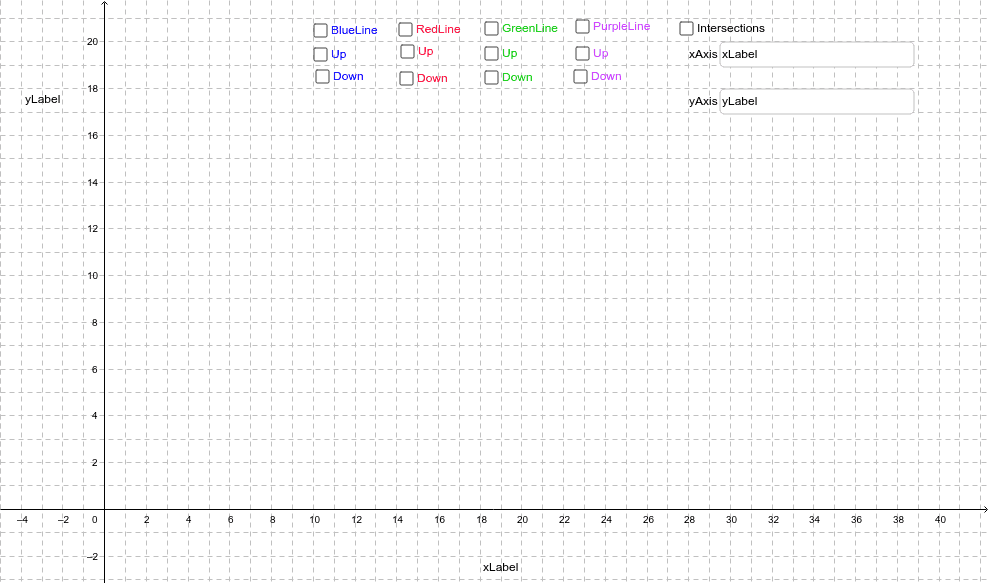
This example demonstrates how to fix a linear programming problem on a grid and label the x&y axes. It involves core math concepts like linear inequalities, feasible region, optimal solution, and coordinate geometry. Construction highlights include using Line, Intersect, and Textfield commands. Suitable for high school and above learners or educational purposes.
GeoGebra Commands & Parameters
Line(A, B) → aLine(C, D) → bLine(E, F) → cLine(G, H) → dIntersect(c, b) → IIntersect(c, a) → JIntersect(c, d) → KIntersect(b, a) → LIntersect(b, d) → MIntersect(a, d) → NIntersect(c, xAxis) → OIntersect(c, yAxis) → PIntersect(b, xAxis) → QIntersect(b, yAxis) → RIntersect(a, xAxis) → SIntersect(a, yAxis) → TIntersect(d, xAxis) → UIntersect(d, yAxis) → VTextfield(xaxis) → inputBox1Textfield(yaxis) → inputBox2
AI Drawing Prompt Reference
Draw a coordinate system with four lines intersecting the x and y axes, creating four intersection points. Find the intersection points between each pair of lines, as well as where each line intersects the x and y axes, totaling eight intersection points. Label the x and y axes at these points to illustrate the feasible region and optimal solution of a linear programming problem.
The prompt above was compiled from the original drawing commands and is for reference only.