
Linear Inequality Test Point Practice: Determine the Solution Region
Loading the math board and drawing, please wait…
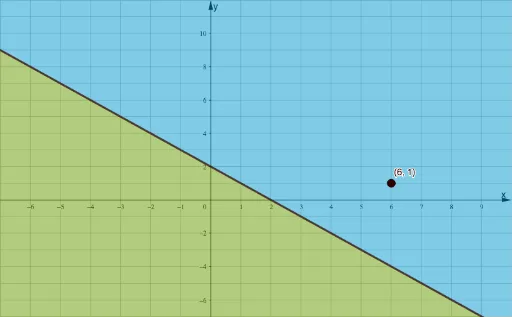
① This example randomly generates a linear inequality and asks the user to click a test point in the coordinate plane to determine whether it satisfies the inequality, visually demonstrating the partition of the solution region. ② Core math concepts include linear inequalities, half-planes, the test-point method, coordinate-plane region determination, and how the inequality sign affects the solution set. ③ Construction highlights: using GeoGebra commands Random and RandomElement to generate coefficients a, b, and constant c, building the inequality f(x,y)=ax+by+c; using If to check the sign of the test point P's coordinates, and Textfield/InputBox for user input with a button to validate; setting xmin, xmax, ymin, ymax for the view, and drawing the line and shaded region. ④ Suitable for middle school to high school students learning linear inequalities or introductory linear programming, and for teachers to use as interactive classroom practice to reinforce the test-point method for identifying solution regions.
GeoGebra Commands & Parameters
Random(-5, 10) → cRandomElement(alist) → aRandomElement(blist) → bRandom(1, 4) → qIf(a ≟ 1, atext1, If[a ≟ -1, "-", atextgt1]) → atextRandom(1, 6) → rIf(b ≟ 1, btext1, btextgt1) → btextRandom(-2, 6) → xAIf(r ≟ f(xA), r - 1, r) → yATextfield(studentanswer) → InputBox1If(a < 1, qtextaneg, qtextapos) → qtext
AI Drawing Prompt Reference
Draw a linear inequality and let the user determine whether a test point on the coordinate plane satisfies the inequality, visually demonstrating the solution region. First, randomly generate the coefficients a, b, and constant c for the linear inequality, and construct the inequality ax+by+c=0. Then, based on the value of a, determine the direction of the inequality sign and generate the inequality expression. Next, randomly generate the coordinates of point A, ensuring that point A is within the half-plane represented by the inequality. Finally, provide an input box for the user to input the coordinates of point A and validate whether point A satisfies the inequality by clicking.
The prompt above was compiled from the original drawing commands and is for reference only.