
Linear Inequality Modeling for Streaming Service Costs
Loading the math board and drawing, please wait…
In collections
CCSS Support Algebra I Unit 1
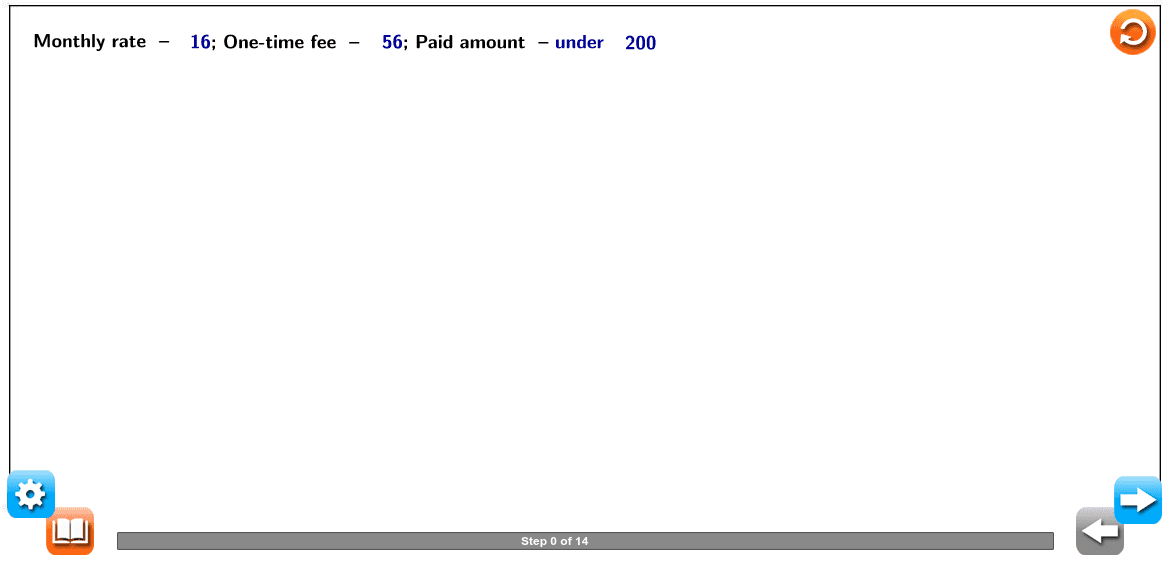
This example demonstrates the linear inequality phenomenon of accumulating video streaming monthly fees and setup costs. Core concepts involve linear function modeling and solving one-variable linear inequalities. Construction utilizes GeoGebra sliders to control variables, text objects to display calculation steps, and line objects to build the cost model. Suitable for middle and high school algebra teaching, helping students intuitively understand inequality applications in real life.
GeoGebra Commands & Parameters
LaTeX("\text{Solve the inequality for the unknown variable.}") → text21LaTeX("\text{Write an inequality to represent the situation.}") → text8LaTeX("\text{Inequality from the previous step}") → text24LaTeX("\text{Simplify.}") → text29Line(A, B) → a_1LaTeX("\text{one term of the inequality.}") → text13LaTeX("\text{}") → text19LaTeX("\text{The total amount Cory has paid so far is the sum of the monthly rate and the one-time fee, }") → text15LaTeX((((("\text{The one-time fee is \textcolor{#000099}{" * b) * "}, so this value is represented by a constant:\textcolor{#000099}{") * b) * "}.}")) → text14LaTeX((((((((("\text{\textcolor{#000099}{" * c) * "}, write \textcolor{#000099}{") * a) * " m + ") * b) * "} on the left side of the less than symbol and \textcolor{#000099}{") * c) * "} on the right side of the symbol.}")) → text18LaTeX((((((("\text{ \textcolor{#000099}{" * a) * "m + ") * b) * " < ") * c) * "}}")) → text22LaTeX((("\text{Subtract \textcolor{#000099}{" * b) * "} from both sides.}")) → text25LaTeX((("\text{Divide both sides by \textcolor{#000099}{" * a) * "}.}")) → text26LaTeX((((("\text{ \textcolor{#000099}{" * a) * " m < ") * cb) * "}}")) → text23LaTeX((("\text{Cory could have been using the service for any number of months less than \textcolor{#000099}{" * s) * "}.}")) → text30Expand(((2 * x) * ((3 * x) - y))) → dLaTeX((((((((("\text{\textcolor{#000099}{\frac{" * a) * " m}{") * a) * "}< \frac{") * cb) * "}{") * a) * "}}}")) → text27LaTeX((("\text{ \textcolor{#000099}{m < " * s) * "}}")) → text28LaTeX("\text{that are not equivalent}") → text31_3LaTeX("\text{Since the problem uses the word under, use a less than symbol (\textcolor{#000099}{<}).}") → text11LaTeX("\text{Monthly rate \textendash}") → text2LaTeX((("\text{\textcolor{#000099}{" * a) * "}; One-time fee \textendash }")) → text5LaTeX("\text{Let \textcolor{#000099}{m} represent the number of months Cory has been subscribing to the service.}") → text9LaTeX((((((((("\text{so add the terms \textcolor{#000099}{" * a) * "m} and \textcolor{#000099}{") * b) * ": ") * a) * " m + ") * b) * "}.}")) → text16LaTeX((((((("\text{Therefore, the inequality is \textcolor{#000099}{" * a) * " m + ") * b) * " < ") * c) * "}.}")) → text20LaTeX((((("\text{The rate increases by \textcolor{#000099}{" * a) * "} for each month \textcolor{#000099}{m} that Cory subscribes. Therefore,\textcolor{#000099}{") * a) * "m} represents }")) → text12LaTeX((((((("\text{Cory has paid less than \textcolor{#000099}{" * c) * "} so far. Since what Cory has paid so far,\textcolor{#000099}{") * a) * "m + ") * b) * "}, is less than}")) → text17LaTeX((("\text{\textcolor{#000099}{" * c) * "}}")) → text7LaTeX((("\text{\textcolor{#000099}{" * b) * "}; Paid amount \textendash \textcolor{#000099}{under} }")) → text6LaTeX("\text{quantities are equal}") → text31_1LaTeX("\text{\mathbf{equation} a mathematical sentence that uses an equal sign (=) to show that two }") → text31LaTeX("\text{\mathbf{inequality} a mathematical sentence that shows the relationship between quantities }") → text31_2
AI Drawing Prompt Reference
Create an algebra illustration modeling a streaming service cost inequality. A coordinate graph shows a sloped linear line representing total cost versus subscription months, paired with interactive variable sliders for monthly rate a, one-time fee b, and spending cap c. Floating text panels walk through the derivation: define m as months, build am+b<c, isolate m by subtracting b then dividing by a, arriving at m<s. Include glossary cards defining equation and inequality with key symbols highlighted in blue. The visual layout guides students from real-world scenario to symbolic reasoning, using clean geometric lines, labeled sliders, and color-coded terms to reinforce the connection between graphical and algebraic representations of linear inequalities.
The prompt above was compiled from the original drawing commands and is for reference only.