
Linear Inequalities Sketching
Loading the math board and drawing, please wait…
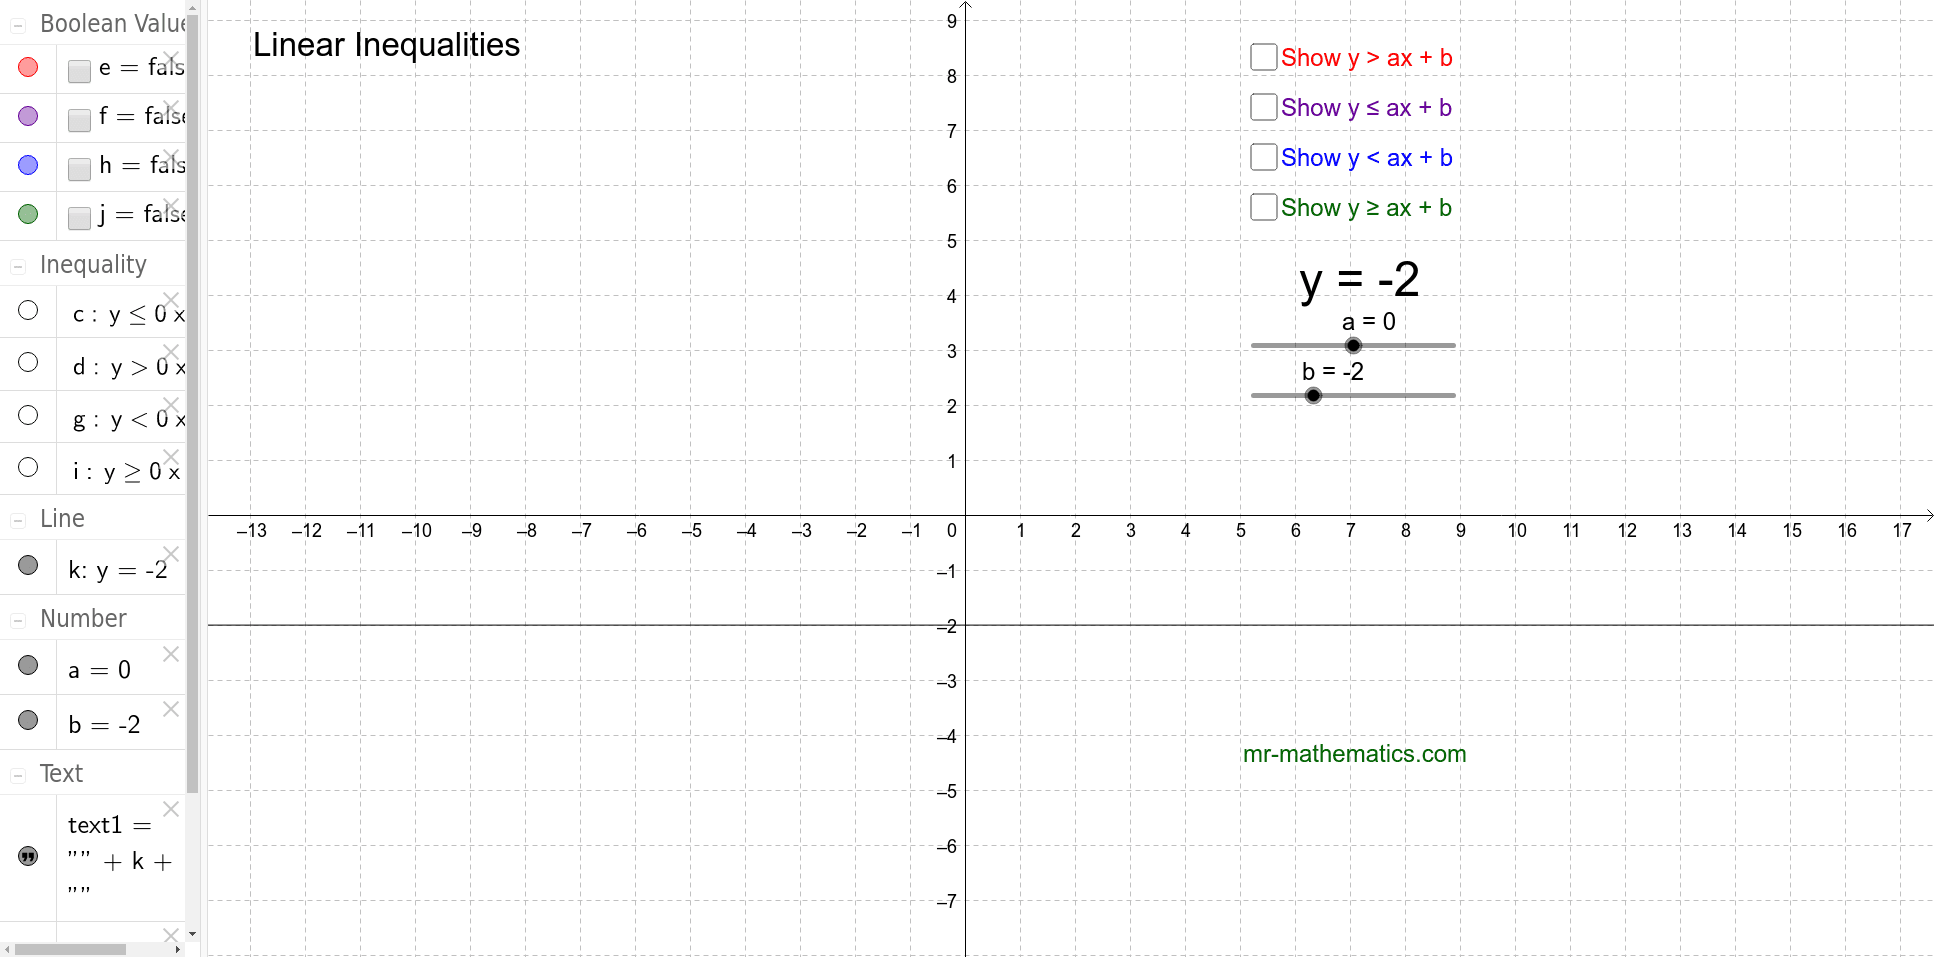
This example demonstrates how to modify equations and sketch inequality graphs. Core math concepts include linear inequalities, function graphing, and coordinate geometry. It uses GeoGebra objects like a, b, c, d, e, f, g, h, i, j, k, text1, text2, text3 for equation modification and inequality display, suitable for high school mathematics teaching to understand the geometric representation and impact of parameter changes on linear inequalities.
GeoGebra Commands & Parameters
Numeric a(0.0)Numeric b(-2.0)c(x, y) = y ≤ (a * x) + bd(x, y) = y > (a * x) + bBoolean e(false)Boolean f(false)g(x, y) = y < (a * x) + bBoolean h(false)i(x, y) = y ≥ (a * x) + bBoolean j(false)y = (a * x) + b
AI Drawing Prompt Reference
Draw a coordinate system and display a line y equals ax plus b, with different colors and shaded regions representing the inequalities y less than or equal to ax plus b, y greater than ax plus b, y less than ax plus b, and y greater than or equal to ax plus b. Observe the changes in the line and shaded regions by sliding the values of a and b.
The prompt above was compiled from the original drawing commands and is for reference only.