
Linear Inequalities Graphical Representation
Loading the math board and drawing, please wait…
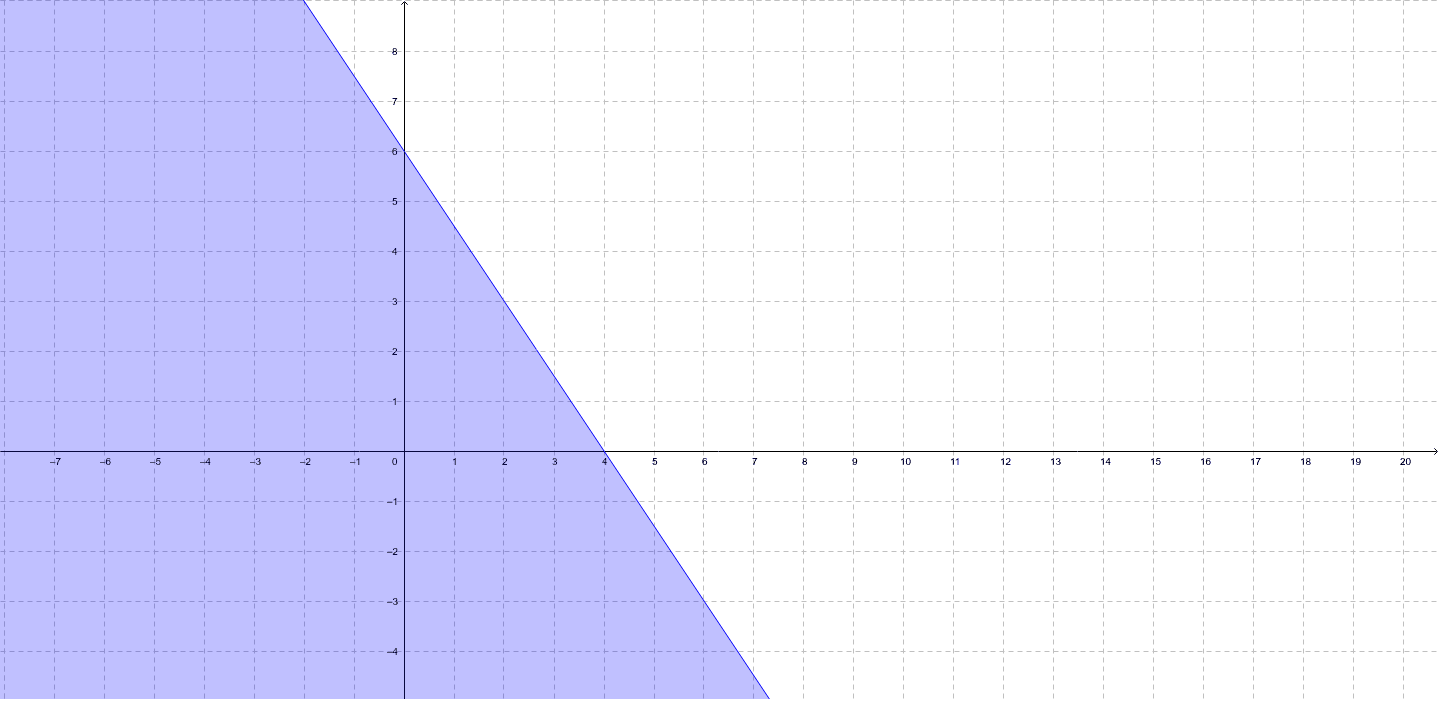
①This example demonstrates how to visualize the solution set of a linear inequality in GeoGebra, using shaded regions or boundary lines to show all points satisfying the condition. ②The core mathematical concept is linear inequalities and their graphical representation, involving half-planes in the Cartesian coordinate system, solid/dashed boundary lines, and the geometric meaning of solution sets. ③Construction highlights: Based on the summary, only object 'a' is created, likely an inequality or line equation; users can directly type a linear inequality (e.g., y > 2x+1) into the input bar, and GeoGebra automatically generates the corresponding region; alternatively, the Inequality command or tool can be used. ④Suitable for middle school to high school students learning the connection between algebra and geometry, useful for understanding solution sets visually, and as a classroom demonstration or self-exploration resource.
GeoGebra Commands & Parameters
a(x, y) = (2 * y) + (3 * x) ≤ 12
AI Drawing Prompt Reference
Draw a Cartesian coordinate system with x and y axes. Plot the boundary line for the linear inequality 2y + 3x ≤ 12, which is a solid line since the inequality includes equality. Then shade the half-plane that satisfies the inequality, i.e., the region below or on the line. Include grid lines for clarity, and label the axes. The final graph should clearly show the shaded solution region bounded by the solid line.
The prompt above was compiled from the original drawing commands and is for reference only.