
Linear Inequalities by Lisa Dailey
Loading the math board and drawing, please wait…
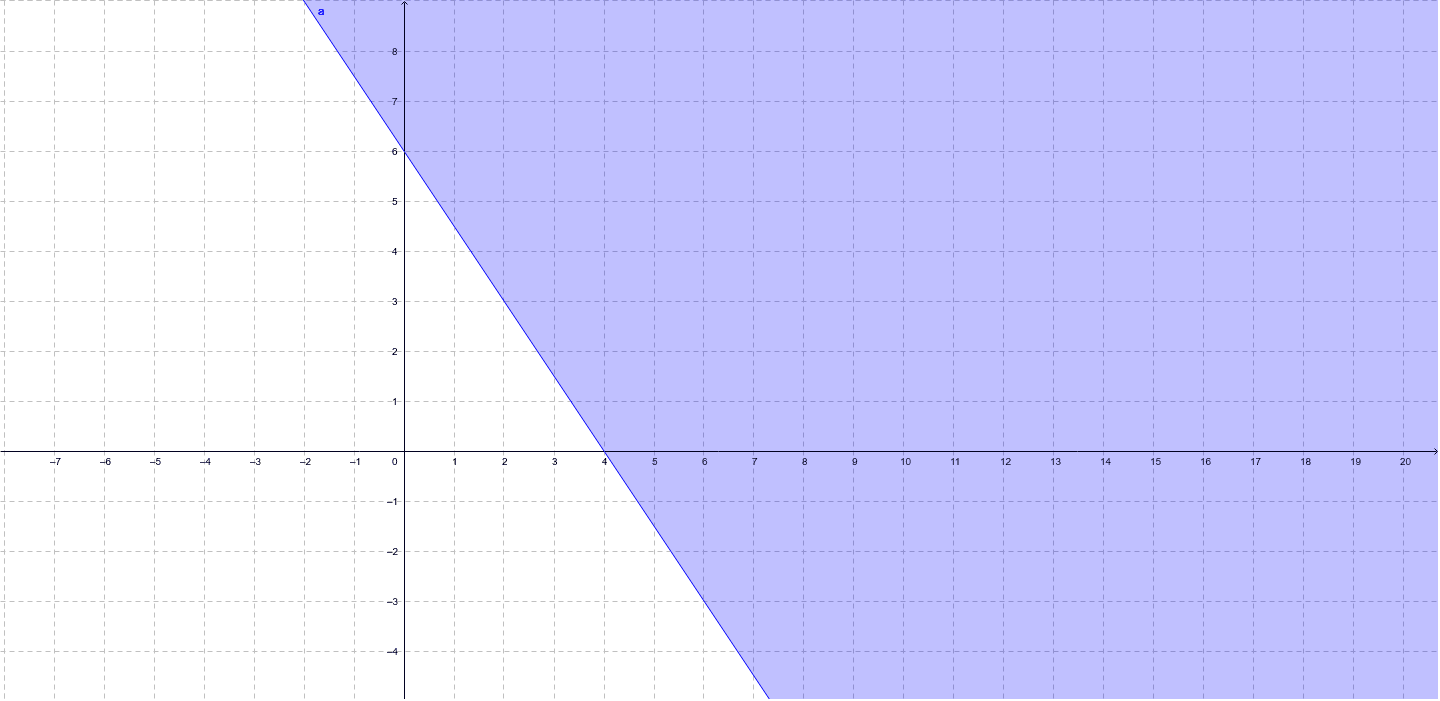
This example demonstrates the graphical representation of linear inequalities. It involves the core mathematical concept of linear inequalities and their representation on the coordinate plane. Using GeoGebra commands, such as `a`, it dynamically shows the solution set of linear inequalities. Suitable for high school mathematics education, helping students understand the geometric meaning of linear inequalities.
GeoGebra Commands & Parameters
a(x, y) = (2 * y) + (3 * x) ≥ 12
AI Drawing Prompt Reference
Draw the line 2y + 3x ≥ 12 and show its solution region. First, draw the line 2y + 3x = 12, then indicate the solution region, which is the area to the right and below the line.
The prompt above was compiled from the original drawing commands and is for reference only.