
Linear Inequalities and Geometric Figures
Loading the math board and drawing, please wait…
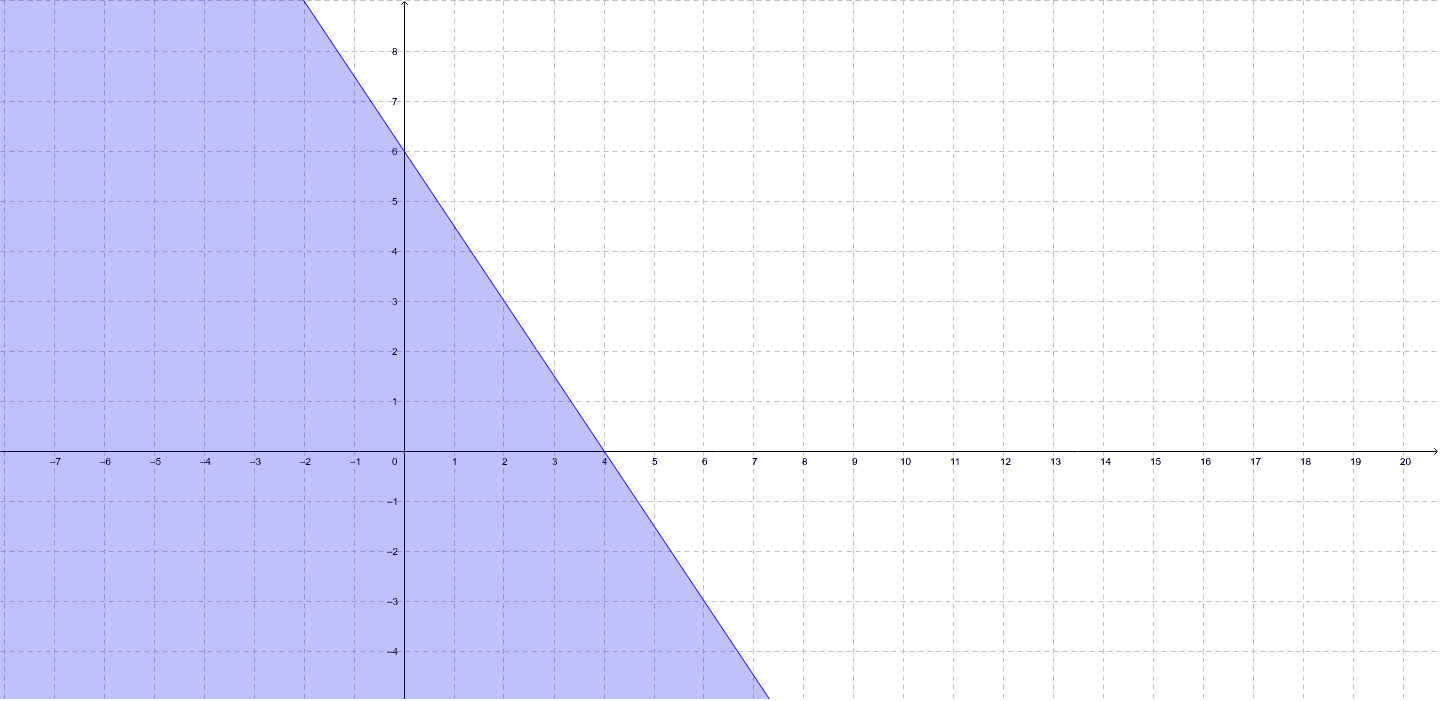
This example demonstrates the application of linear inequalities in geometric figures. Key mathematical concepts include linear inequalities, coordinate geometry, and region representation. Construction involves using GeoGebra commands to create inequality objects, draw lines, and determine feasible regions. Suitable for high school students learning linear algebra and geometric analysis, as well as for mathematical modeling exercises.
GeoGebra Commands & Parameters
a(x, y) = (2 * y) + (3 * x) ≤ 12
AI Drawing Prompt Reference
Draw a coordinate plane featuring a half-plane region defined by the linear inequality 2y plus 3x is less than or equal to 12. First, plot the boundary line corresponding to 2y plus 3x equals 12, which has a negative slope and intersects the axes at (0,6) and (4,0). Then, shade the region satisfying the inequality, which lies below and including the line, to clearly indicate the feasible area. Include labeled axes with tick marks and a grid for reference. The overall figure illustrates the application of linear inequalities in geometric shapes, emphasizing the relationship between the boundary line and the shaded region.
The prompt above was compiled from the original drawing commands and is for reference only.