
Linear Equations x, y Intercepts Analysis
Loading the math board and drawing, please wait…
In collections
Apps for Formative Assessment Grade 10
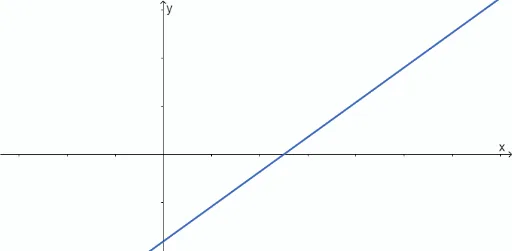
This example demonstrates the graph of linear function equations and their x, y intercepts. Core math concepts include linear equations, intercepts, slope, and coordinate geometry. It is constructed using GeoGebra commands like RandomElement, Simplify, GCD, If, Textfield, Random, and objects such as listx, listy, m, f5, f6, gdcint, cC, aA, aAn, bB, f2, bBn, g, A, B, text1, inputxint, inputyint, button1, tryagx, tryagyeq, tryagy, f, ymin, ymax, button2, b, checkx, checkyeq, checkm, checky, tryagm, InputBox1, InputBox2, InputBox3, text10, qQ, qtext for interactive analysis. Suitable for high school mathematics teaching to understand the properties of linear functions and intercept calculations.
GeoGebra Commands & Parameters
RandomElement(listx) → xintRandomElement(listy) → yintSimplify((m * x) + yint) → f6GCD(xint, yint) → gdcintIf(m < 0 ∧ yint > 0, f5, f6) → f2If(aA > 0, (aA * x) + (bB * y) = (-cC), (aAn * x) + (bBn * y) = cC) → gTextfield(inputxint) → InputBox1Textfield(inputyint) → InputBox2Textfield(f) → InputBox3Random(0, 1) → qQIf(qQ ≟ 0, text1, text10) → qtextTextfield(inputm) → InputBox4If(aA > 0, (aA * x) + (bB * y), (aAn * x) + (bBn * y)) → f3If(aA > 0, (-cC), cC) → dDTextfield(f4) → InputBox5
AI Drawing Prompt Reference
Draw a line passing through a randomly generated x-intercept xint and y-intercept yint. Set the equation of the line in the form y = mx + b, where m is a randomly generated slope. Display the equation of the line and allow users to input x and y intercept values. Adjust the line's display based on the sign of the slope m and the y-intercept yint. Plot the graph of the line and show its intersection points with the x-axis and y-axis.
The prompt above was compiled from the original drawing commands and is for reference only.