
Linear and Non-linear Equations Demo
Loading the math board and drawing, please wait…
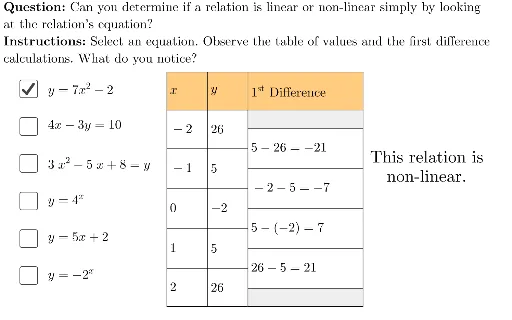
This example demonstrates linear and non-linear equations through interactive graphics, showing solutions and graphical representations. Core math concepts include equation solving, linear functions, non-linear functions, and geometric construction. GeoGebra commands like Polygon, LaTeX, Zip, Sequence, and objects such as TryAnother, viewBox, Initialize are used in the construction. Suitable for high school mathematics teaching to visualize the relationship between function graphs and equations.
GeoGebra Commands & Parameters
Polygon({(-11, -11), (-11, 11), (11, 11), (11, -11)}) → viewBoxLaTeX((((("\text{" * QUESTION) * "\\") * INSTRUCTIONS) * "}")) → TEXTLaTeX(eq1) → eq1LabelLaTeX(eq2) → eq2LabelLaTeX(eq3) → eq3LabelLaTeX(eq4) → eq4LabelLaTeX(eq5) → eq5LabelLaTeX(eq6) → eq6LabelZip(activeFunc(A), A, xs) → ysSequence(ys(k), k, 2, 5) → yList1Sequence(ys(k), k, 1, 4) → yList2Zip(A - B, A, yList1, B, yList2) → firstDiffs