
Solving Quadratic Equations via Graphs: Parabola–Root Connection
Loading the math board and drawing, please wait…
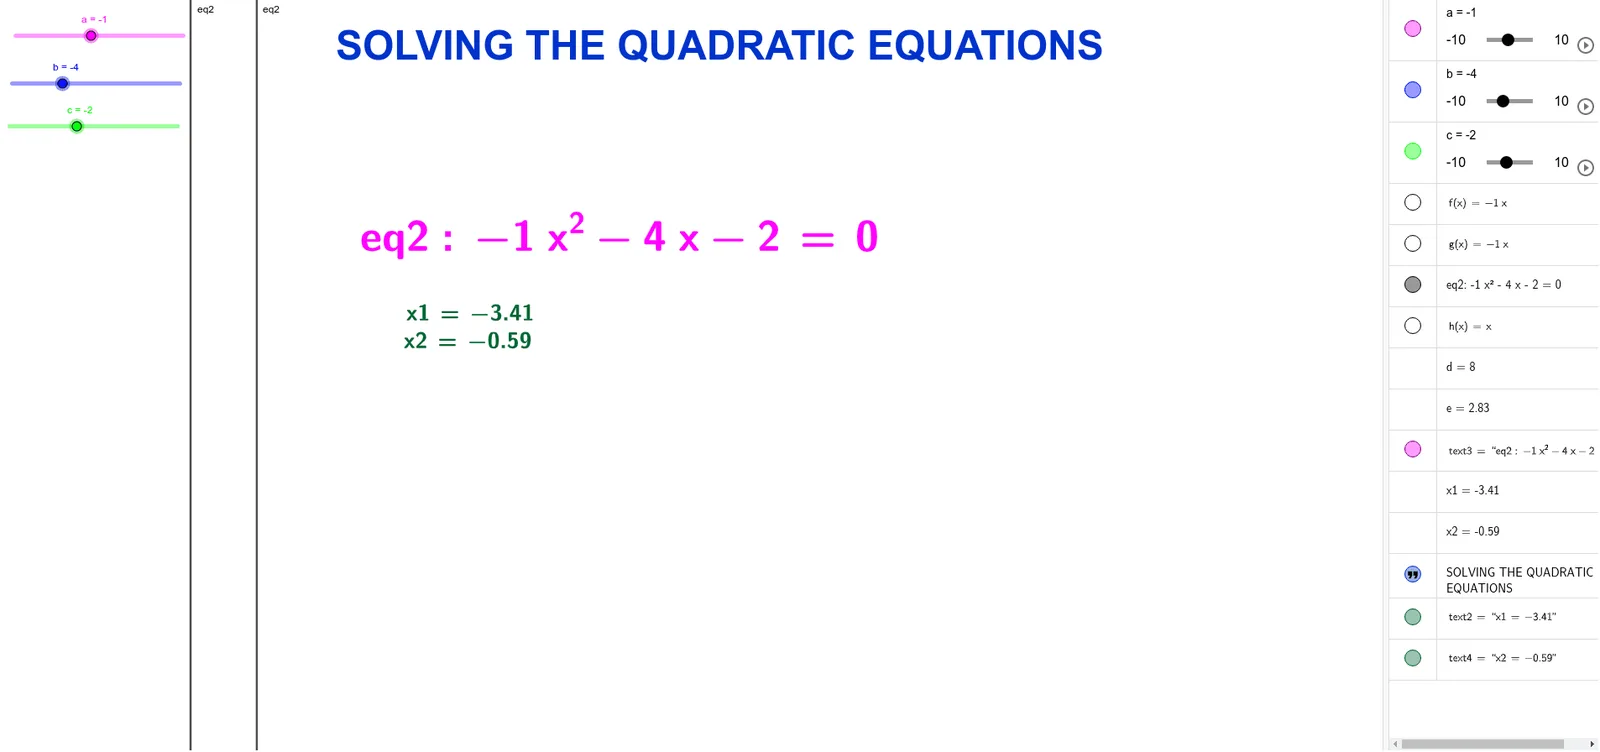
This example demonstrates how to solve quadratic equations by linking algebraic roots to the graphical behavior of a parabola in the coordinate plane. It highlights the relationship between a quadratic equation and its corresponding quadratic function, showing that the solutions are represented by key points such as the intercepts (roots) x1 and x2. The construction uses LaTeX text objects (text1, text2, text3, text4) to display the mathematical expressions clearly, while parameters a, b, c and derived expressions (f, g, eq2, d, e, h) generate the quadratic equation/function being studied. The setup is designed to make the equation’s solution(s) visually accessible and to support discussion of how changing coefficients affects the roots and the graph. Suitable for middle and high school math learning, especially when teaching the “functions and equations” connection, graph-based reasoning, and quadratic solving strategies.
GeoGebra Commands & Parameters
LaTeX(eq2, true, true) → text3LaTeX(x1, true, true) → text2LaTeX(x2, true, true) → text4
AI Drawing Prompt Reference
Create a coordinate-plane visualization linking a quadratic equation to its graph. Use parameters a, b, c to form the corresponding quadratic expression and quadratic function. Place clear LaTeX-style text on the diagram to display the main equation and the relevant expressions. Mark the two algebraic roots as key quantities labeled x1 and x2, and emphasize their role as the intercepts where the parabola meets the x-axis. Include the additional formatted equation expression as a support for discussing how the solutions correspond to the graph’s key points and how changing coefficients affects the roots and the parabola.
The prompt above was compiled from the original drawing commands and is for reference only.