
Graphing Linear Inequalities Quiz
Loading the math board and drawing, please wait…
In collections
Graphing Linear Inequalities Book
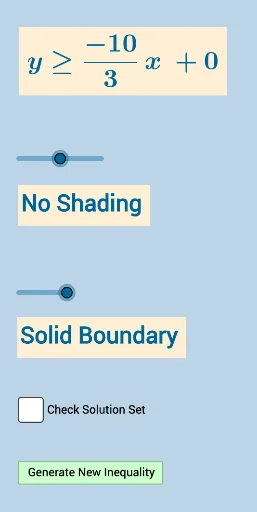
This example demonstrates how to graph linear inequalities in two variables on the coordinate plane as an interactive quiz with feedback. Core mathematical concepts include: solution sets of linear inequalities, coordinate plane partitioning, and the relationship between boundary lines and shaded regions. Construction highlights: using Line command to draw boundary lines, Slope to calculate line orientation, Sequence and Union to generate random inequality problems, and Random command to create varied quiz questions with instant feedback for error correction. Suitable for middle to high school math students learning inequality graphing, and can serve as a classroom demonstration tool or self-practice resource for teachers.
GeoGebra Commands & Parameters
Sequence(i, i, -10, -1) → aSequence(i, i, -10, -1) → bSequence(i, i, 1, 10) → cUnion(b, c) → dRandom(-10, 10) → eLine(A, B) → iFractionText(Slope[f]) → text1FractionText(f(0)) → text2Random(1, 4) → symbolLine(A, B) → hSlope(i) → slope_i
AI Drawing Prompt Reference
Draw a coordinate plane and plot two lines as the boundaries of the inequalities. The slope of the first line is randomly generated, and so is its y-intercept. The slope of the second line is the same as the first one, but the y-intercept is different. Use these two lines to partition the coordinate plane and label their slopes and y-intercepts.
The prompt above was compiled from the original drawing commands and is for reference only.