
Geometric Demonstration of Absolute Value Equations and Inequalities
Loading the math board and drawing, please wait…
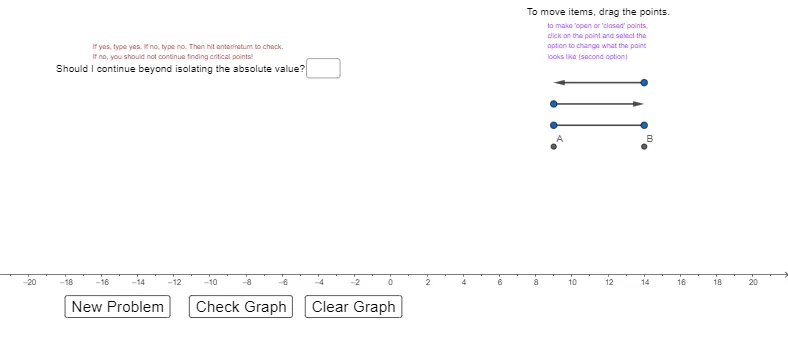
This example dynamically demonstrates the geometric interpretation of absolute value equations and inequalities, visually presenting the relationship between solution sets and graphical representations. It involves core mathematical concepts such as absolute value functions, equation solutions, inequality regions, and coordinate geometry. The construction utilizes GeoGebra commands and objects like RandomDiscrete, Vector, Segment, Random, DivisorsList, Factors, If, Max, Min, Textfield, RandomElement, Element, Line for random generation and interactive exploration. Suitable for high school mathematics education to understand the graph and properties of absolute value functions and enhance analytical geometry skills.
GeoGebra Commands & Parameters
RandomDiscrete({1, 2, 3, 4, 5}, {2, 5, 5, 5, 5}) → whatwegetVector(C, D) → uVector(E, F) → aSegment(G, H) → fRandom(-60, 60) → KRandom(-60, 60) → QstartRandomDiscrete({Qstart, 0}, {8, 2}) → QDivisorsList(abs(K - Q)) → LposFactors(abs(K - Q)) →If(K - Q > 0, Lpos, K - Q < 0, Lneg, RandomElement[{-3, -2, -1, 1, 2, 3, 4, 5}]) → LwinIf(K - Q < 0, Lpos, K - Q > 0, Lneg, RandomElement[{-3, -2, -1, 1, 2, 3, 4}]) → LlossRandomDiscrete({RandomElement[Lwin], RandomElement[Lloss]}, {85, 15}) → LRandom(-20, 20) → PstartRandomDiscrete({Pstart, 0}, {8, 2}) → PRandomDiscrete({-10, 10, 8, -8, 5, -5, 4, -4, 3, -3, 2, -2, 1, -1}, {1, 1, 1, 1, 3, 2, 3, 2, 3, 2, 4, 3, 5, 2}) → MMax({x_{one}, x_{two}}) → ans_{1}Min({x_{one}, x_{two}}) → ans_{2}If((K - Q) / L ≥ 0, 1, (K - Q) / L < 0, 0) → FinishIf(Finish ≟ 1, ans_{1}, Finish ≟ 0, NaN) → x_{1}If(Finish ≟ 1, ans_{2}, Finish ≟ 0, NaN) → x_{2}If(Finish ≟ 1, "yes", Finish ≟ 0, "no") → obviousTextfield(text4) → InputBox1Textfield(guess2) → InputBox2Textfield(guess1) → InputBox3RandomElement({1, 2, 3, 4}) → whatweget2Element({{equal1, equal2, equal3, equal4}, {GT1, GT2, GT3, GT4}, {LT1, LT2, LT3, LT4}, {GTE1, GTE2, GTE3, GTE4}, {LTE1, LTE2, LTE3, LTE4}}, whatweget, whatweget2) → whattheyseeTextfield(multchoice) → InputBox4If(Finish ≟ 1 ∧ L > 0, 1, Finish ≟ 1 ∧ L < 0, 2, Finish ≟ 0 ∧ L > 0, 3, Finish ≟ 0 ∧ L < 0, 4) → flipsignElement({{"G", "G", "A", "A"}, {"D", "F", "A", "B"}, {"F", "D", "B", "A"}, {"C", "E", "A", "B"}, {"E", "C", "B", "A"}}, whatweget, flipsign) → multchoiceanswerVector(LeftPt, (x_{2} - 5, 0)) → LeftVectorVector(RightPt, (x_{1} + 5, 0)) → RightVectorLine(LeftPt, RightPt) → WholeLineSegment(LeftPt, RightPt) → Segment1If(whatweget ≟ 1, Element[{equal1, equal2, equal3, equal4}, whatweget2]) → whattheysee2
AI Drawing Prompt Reference
Draw a geometric demonstration of absolute value equations and inequalities, showing randomly generated points and vectors, determining the solution sets and graphical representations of inequalities through coordinate geometry relationships, including line segments, regions, and text annotations, ultimately presenting the correspondence between solution sets and graphical representations, suitable for high school mathematics education to understand the graph and properties of absolute value functions.
The prompt above was compiled from the original drawing commands and is for reference only.