
Function Transformations with Horizontal Stretch
Loading the math board and drawing, please wait…
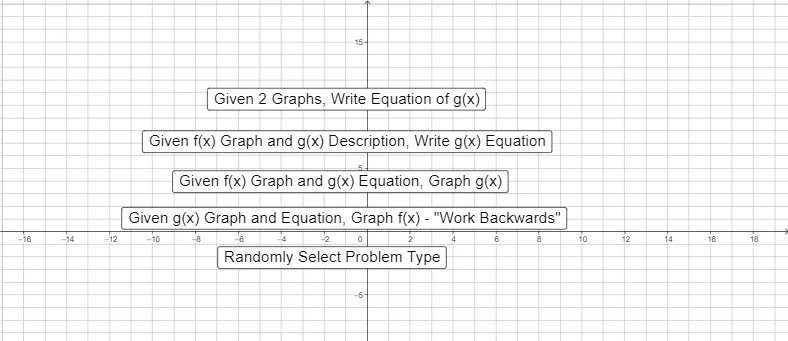
This example illustrates how to apply a horizontal stretch transformation to a function graph. It covers key concepts such as scaling factors, coordinate mapping, and the effect of horizontal dilation on the shape of the graph. The GeoGebra construction uses Random, RandomElement, RandomDiscrete, If, and Textfield commands to create interactive input boxes and buttons, allowing users to adjust parameters and see the updated function f_{new} instantly. It is designed for high‑school or early university students learning function transformations and can serve as an interactive classroom demonstration or a self‑paced exploration activity.
GeoGebra Commands & Parameters
Random(-4, 4) → rRandomElement({-2, -3 / 2, -1, -1 / 2, 1 / 2, 1, 3 / 2, 2}) → mRandomElement({-3, -2, -1, 1, 2, 3}) → nRandom(-5, 5) → pRandomElement({-2, -1, 1, 2}) → qRandomDiscrete({1, 2, 3, 4, 5}, {1, 1, 3, 3, 10}) → whatwegetRandomElement({-3, -2, -1, -1 / 2, -1 / 3, 1 / 3, 1 / 2, 1, 2, 3}) → bIf(whatweget ≟ 1, A, whatweget ≟ 2, B, whatweget ≟ 3, C, whatweget ≟ 4, D, whatweget ≟ 5, E) → fRandomElement({-3, -2, -1, -1 / 2, 1 / 2, 1, 2, 3}) → aRandom(-6, 6) → cRandom(-6, 6) → dRandomDiscrete({1, 2, 3, 4}, {67, 67, 33, 33}) → ShowProblemTextfield(a1) → InputBox1Textfield(c1) → InputBox2Textfield(d1) → InputBox3Textfield(m_{1}) → InputBox4Textfield(x_{1}) → InputBox5Textfield(y_{1}) → InputBox6Textfield(a_{L1}) → InputBox7Textfield(b_{L1}) → InputBox8Textfield(m_{2}) → InputBox9Textfield(x_{2}) → InputBox10Textfield(y_{2}) → InputBox11Textfield(a_{L2}) → InputBox12Textfield(b_{L2}) → InputBox13Textfield(m_{3}) → InputBox14Textfield(x_{3}) → InputBox15Textfield(y_{3}) → InputBox16Textfield(a_{L3}) → InputBox17Textfield(b_{L3}) → InputBox18Textfield(w) → InputBox19Textfield(a_{h}) → InputBox20Textfield(b_{h}) → InputBox21Textfield(a_{C}) → InputBox22Textfield(b_{C}) → InputBox23Textfield(y_{C}) → InputBox24Textfield(y_{P}) → InputBox25Textfield(b1) → InputBox26
AI Drawing Prompt Reference
Please draw a graphic illustrating a horizontal stretch transformation of a function. Include an original function graph, such as y=x^2, and a transformed function graph whose shape is obtained by stretching the original graph horizontally. Add input boxes to enter the stretch factor and display the transformed function. The construction order: first draw the original function graph, then draw the transformed function graph based on the value entered in the input box, and finally add the input boxes to allow users to adjust parameters and view the result in real time.
The prompt above was compiled from the original drawing commands and is for reference only.