
Linear and Exponential Functions Comparison
Loading the math board and drawing, please wait…
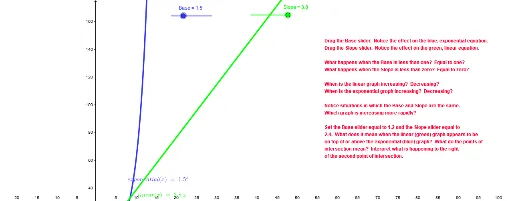
This example demonstrates the comparison of linear and exponential function graphs, highlighting their growth rates and patterns. Key math concepts include function graphs, growth rates, slopes, and exponential operations. It is constructed using GeoGebra commands like Base, exponential, Slope, linear, and text1. Suitable for high school mathematics education to understand the characteristics and practical applications of different function models.
GeoGebra Commands & Parameters
Numeric Base(1.5)exponential(x) = Base^(x)Numeric Slope(3.8)linear(x) = (Slope * x)
AI Drawing Prompt Reference
Draw a comparison between a linear function and an exponential function. The slope of the linear function is 3.8, and the base of the exponential function is 1.5. First, plot the exponential function, then plot the linear function, and finally add text to describe the growth rates and characteristics of both functions.
The prompt above was compiled from the original drawing commands and is for reference only.