
Line Integral for Planar Curves
Loading the math board and drawing, please wait…
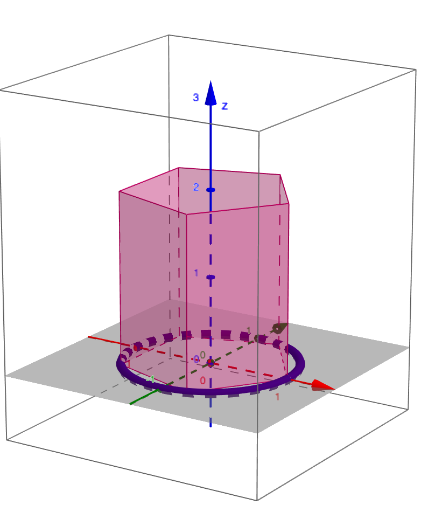
This example demonstrates the calculation and geometric interpretation of line integrals on planar curves. Key math concepts include integration, vector fields, parametric equations, and line integrals in calculus. It utilizes GeoGebra commands/objects like CurveCartesian, Sequence, Textfield, If, R, f, n, mx, my, ay, ax, d, A, B, C, D, E, F, points2d, pts3d, pointsurface, InputBox, buttons, and lists for interactive visualization. Suitable for university mathematics, calculus teaching, and physics field line integral visualization.
GeoGebra Commands & Parameters
CurveCartesian(mx(i), my(i), i, ax, ay) → dSequence(d(ax + (k * (ay - ax) / n)), k, 0, n, 1) → points2dSequence(d(ax + (k * (ay - ax) / n)) + (0, 0, 0), k, 0, n, 1) → pts3dSequence((x(Element[points2d, k]), y(Element[points2d, k]), f(x(Element[points2d, k]), y(Element[points2d, k]))), k, 1, n + 1, 1) → pointsurfaceTextfield(f) → InputBox1Textfield(mx) → InputBox2Textfield(my) → InputBox3Textfield(ax) → InputBox4Textfield(ay) → InputBox5Sequence(Segment[Element[points2d, k], Element[points2d, k + 1]], k, 1, n) → partition2dSequence((f(d(ax + ((k - 1 + R) * (ay - ax) / n))) * Element[partition2d, k]), k, 1, n) → heightsurfaceIf(Final ≟ Initial ∧ n ≟ 2, Element[heightsurface, 2], Polygon[(1, 0), (1, 0)]) → condition1Textfield(n) → InputBox6Sequence(d(ax + ((k - 1 + R) * (ay - ax) / n)) + (0, 0, 0), k, 1, n) → list1Sequence((x(Element[list1, i]), y(Element[list1, i]), f(Element[list1, i])), i, 1, n) → list2Sequence((x(Element[pts3d, i]), y(Element[pts3d, i]), z(Element[list2, i])), i, 1, n) → list3Sequence((x(Element[pts3d, i + 1]), y(Element[pts3d, i + 1]), z(Element[list2, i])), i, 1, n) → list4Sequence(Polygon[Element[pts3d, k], Element[pts3d, k + 1], Element[list4, k], Element[list3, k]], k, 1, n) → rectangles
AI Drawing Prompt Reference
Visualize a line integral for a planar curve, demonstrating the calculation and geometric interpretation. Start by drawing a parametric curve, then generate points along it to form a 3D surface representing function values. Next, create segments on the curve and calculate the function values for each segment to build a height surface. Finally, connect these heights to the curve to form rectangles, illustrating the geometric meaning of the line integral.
The prompt above was compiled from the original drawing commands and is for reference only.