
Line Game: Adjust the Function to Pass Through Given Blue Points
Loading the math board and drawing, please wait…
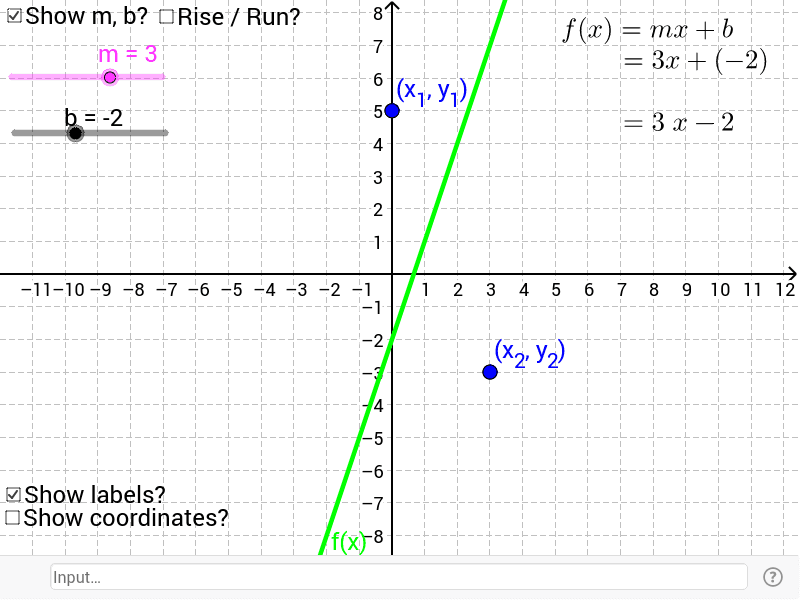
This interactive GeoGebra example presents a game-like activity where students adjust a linear function f(x) so that its graph passes through two specified blue points (x₁, y₁) and (x₂, y₂). The core mathematical concepts include the slope and intercept of a linear function, the principle that two points determine a unique line, and the relationship between algebraic equations and their graphical representations. The construction uses GeoGebra commands such as If and FractionText to dynamically display the slope and intercept as fractions, along with sliders or draggable points to modify the line's slope (run/rise) and intercept. Multiple text objects (text1 through text7) show step-by-step calculations, including the slope formula and point-slope form. This example is suitable for middle or high school students learning about linear functions, straight-line equations, and graphing. It serves as an engaging classroom activity to reinforce understanding of how parameters in a linear equation affect the position and orientation of its graph.
GeoGebra Commands & Parameters
If(d, 2, 0) → tFractionText(If[d, rise / run, m]) → sloop
AI Drawing Prompt Reference
Draw a game scenario with an adjustable line and two fixed blue points that the line must pass through. Use sliders or draggable points to adjust the slope and intercept of the line, dynamically displaying the slope and intercept as fractions. Add multiple text objects to show step-by-step calculations of the slope formula and point-slope form, helping to understand how parameters affect the line's position and orientation.
The prompt above was compiled from the original drawing commands and is for reference only.