
Event Recording Chart
Loading the math board and drawing, please wait…
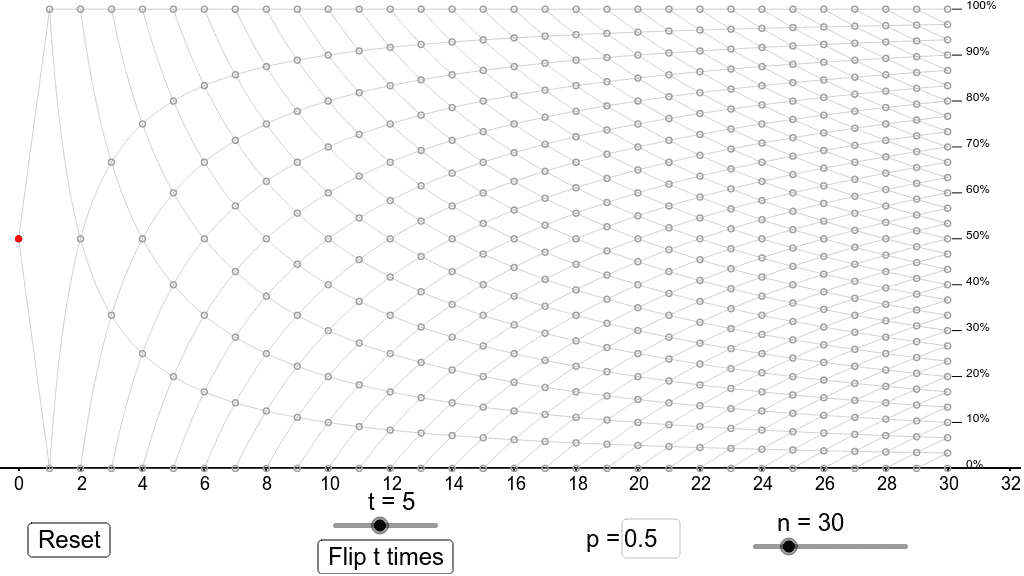
This example demonstrates the recording of results from successive events. It involves core concepts of probability and statistics. Using GeoGebra commands such as Sequence, Textfield, and PolyLine, a dynamic event recording chart is constructed. Suitable for teaching and learning probability and statistics.
GeoGebra Commands & Parameters
Sequence(Sequence[(s, (100 * t / s)), t, 0, s], s, 1, n) → greydotsSequence(If[w < x < n,(100 * w / x)], w, 1, n - 1) → PathPosSequence(If[t < x < n,(100 * (1 - t / x))], t, 1, n - 1) → PathNegSequence(Text[t + "%", ((1.02 * n), t)], t, 0, 100, 10) → labelsSequence(Segment[((1.005 * n), t), ((1.015 * n), t)], t, 0, 100, 10) → labelsegmentsTextfield(p) → pboxPolyLine(Append[(0, 50), Sequence[(w, (100 * Sum[First[flips, w]] / w)), w, 1, n]]) → path
AI Drawing Prompt Reference
Create an event recording chart to show the results of successive events. Start by drawing a series of gray dots, then plot positive and negative paths based on the event outcomes. Add percentage labels and label segments, and finally use a text box to input the current event result and connect these points with a polyline.
The prompt above was compiled from the original drawing commands and is for reference only.