
Level Curves of a Two-Variable Function
Loading the math board and drawing, please wait…
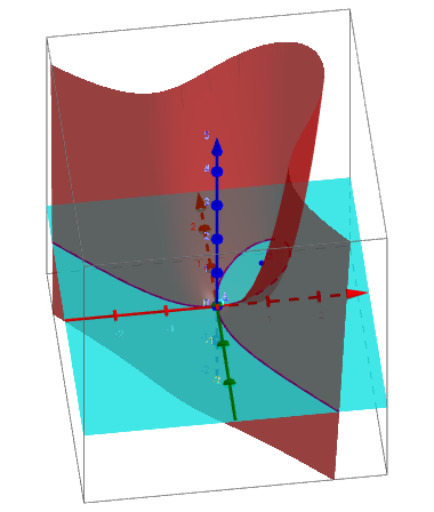
① This GeoGebra example dynamically displays the level curves (contour lines) of a two-variable function f(x,y), showing the family of curves where the function equals different constants k. ② The core mathematical concept is level curves in multivariable calculus, which help visualize horizontal slices of a surface, the direction of the gradient, and how function values change; it also involves ellipses and quadratic curves. ③ Construction highlights: from the summary, a slider k controls the contour height, the function f is defined, parameters a and b adjust the curve shape, points A and B and object g may represent auxiliary lines or gradients, the 'rastro' (trace) feature tracks moving points, and a button (botón1) triggers animation or reset, enabling dynamic observation of how level curves change with k. ④ Suitable for introductory university calculus or multivariable function courses, and also for advanced high school enrichment, providing an intuitive bridge from single-variable graphs to level sets, and preparing students for partial derivatives, gradients, and extrema.
GeoGebra Commands & Parameters
f(x, y) = x^(3) + y^(3) - ((3 * x) * y)Numeric k(0)a: x^(3) + y^(3) - ((3 * x) * y) = kz = kPoint A(0, 0)Point B(1, 1)g(x, y) = kNumeric rastro(0)
AI Drawing Prompt Reference
Draw the level curves of a two-variable function f(x,y) = x^3 + y^3 - 3xy, using a slider k to control the height of the level curves starting from 0. Adjust parameters a and b to change the curve shape. Plot points A and B as references, with A at the origin and B at (1,1). Generate level curves with the equation x^3 + y^3 - 3xy = k, where k is the slider value. Use the rastro feature to track the movement of points.
The prompt above was compiled from the original drawing commands and is for reference only.