
Law of Large Numbers Demonstration
Loading the math board and drawing, please wait…
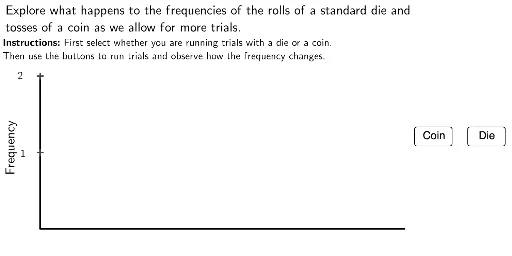
This example demonstrates the Law of Large Numbers, showing how the frequency of an event approaches its theoretical probability as the number of trials increases. Key mathematical concepts include frequency stability and probability limits. It uses GeoGebra commands such as If, Segment, LaTeX, RotateText, and Polygon to construct multiple bar charts to visually demonstrate frequency changes. Suitable for high school and above students or teachers.
GeoGebra Commands & Parameters
If(Mod[Max[{freq1, freq2, freq3, freq4, freq5, freq6}], 2] ≟ 0, Max[{freq1, freq2, freq3, freq4, freq5, freq6}] + 2, Max[{freq1, freq2, freq3, freq4, freq5, freq6}] + 3) → maxFreqIf(maxFreq ≟ 0, 1, Min[1, (MaxY - MinY) / maxFreq]) → yheightSegment((MinX, MinY), (MinX, MaxY)) → yaxisSegment((MinX, MinY), (MaxX, MinY)) → xaxisLaTeX((("" * maxFreq) * "")) → Label1LaTeX((("" * maxFreq / 2) * "")) → Label2RotateText("Frequency", π / 2) → FreqLaTeX("Explore\ what\ happens\ to\ the\ frequencies\ of\ the\ rolls\ of\ a\ standard\ die\ and\\ tosses\ of\ a\ coin\ as\ we\ allow\ for\ more\ trials.") → InstructionsLaTeX("\textbf{Instructions\text{:}}\ First\ select\ whether\ you\ are\ running\ trials\ with\ a\ die\ or\ a\ coin.\\ Then\ use\ the\ buttons\ to\ run\ trials\ and\ observe\ how\ the\ frequency\ changes.") → Instructions2Polygon((MinX + BetweenBars, MinY), (MinX + BarWidth + BetweenBars, MinY), (MinX + BarWidth + BetweenBars, MinY + (freq1 * yheight)), (MinX + BetweenBars, MinY + (freq1 * yheight))) → Bar1, f, g, h, iPolygon((MinX + (2 * BetweenBars) + BarWidth, MinY), (MinX + (2 * (BarWidth + BetweenBars)), MinY), (MinX + (2 * (BarWidth + BetweenBars)), MinY + (freq2 * yheight)), (MinX + (2 * BetweenBars) + BarWidth, MinY + (freq2 * yheight))) → Bar2, j, k, l, mPolygon((MinX + (3 * BetweenBars) + (2 * BarWidth), MinY), (MinX + (3 * (BarWidth + BetweenBars)), MinY), (MinX + (3 * (BarWidth + BetweenBars)), MinY + (freq3 * yheight)), (MinX + (3 * BetweenBars) + (2 * BarWidth), MinY + (freq3 * yheight))) → Bar3, n, p, q, rPolygon((MinX + (4 * BetweenBars) + (3 * BarWidth), MinY), (MinX + (4 * (BarWidth + BetweenBars)), MinY), (MinX + (4 * (BarWidth + BetweenBars)), MinY + (freq4 * yheight)), (MinX + (4 * BetweenBars) + (3 * BarWidth), MinY + (freq4 * yheight))) → Bar4, s, t, a, bPolygon((MinX + (5 * BetweenBars) + (4 * BarWidth), MinY), (MinX + (5 * (BarWidth + BetweenBars)), MinY), (MinX + (5 * (BarWidth + BetweenBars)), MinY + (freq5 * yheight)), (MinX + (5 * BetweenBars) + (4 * BarWidth), MinY + (freq5 * yheight))) → Bar5, c, d, e, f_1Polygon((MinX + (6 * BetweenBars) + (5 * BarWidth), MinY), (MinX + (6 * (BarWidth + BetweenBars)), MinY), (MinX + (6 * (BarWidth + BetweenBars)), MinY + (freq6 * yheight)), (MinX + (6 * BetweenBars) + (5 * BarWidth), MinY + (freq6 * yheight))) → Bar6, g_1, h_1, i_1, j_1