
Koch Curve Demonstration
Loading the math board and drawing, please wait…
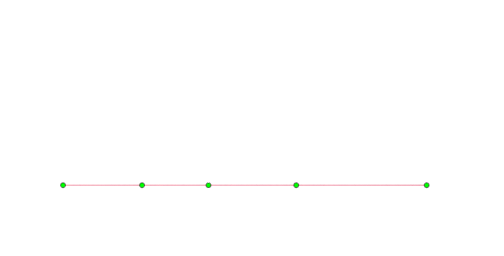
This example demonstrates the construction process of the Koch curve, a classic fractal geometry. It involves core mathematical concepts such as fractals, limits, iterative construction, and trigonometric functions. The construction uses commands/objects like Point, PolyLine, and Segment in GeoGebra. Suitable for high school students and above to learn fractal geometry, algorithmic drawing, and introductory calculus, or for math clubs' demonstrations.
GeoGebra Commands & Parameters
Point(xAxis) → APoint(xAxis) → BPoint(xAxis) → DPoint(xAxis) → EPolyLine(A, B, C, D, E) → fSegment(A, B) → aSegment(B, C) → bSegment(C, D) → cSegment(D, E) → dSegment(A, E) → t
AI Drawing Prompt Reference
Place several points on a common horizontal axis in the correct order (four key point positions from start to end). Connect them sequentially with a polyline to form the main piecewise curve outline. Then draw the individual segments between consecutive points to highlight the construction of each sub-interval, and also include the segment joining the first and last points as the overall baseline connection.
The prompt above was compiled from the original drawing commands and is for reference only.