
Key Features of a Parabola
Loading the math board and drawing, please wait…
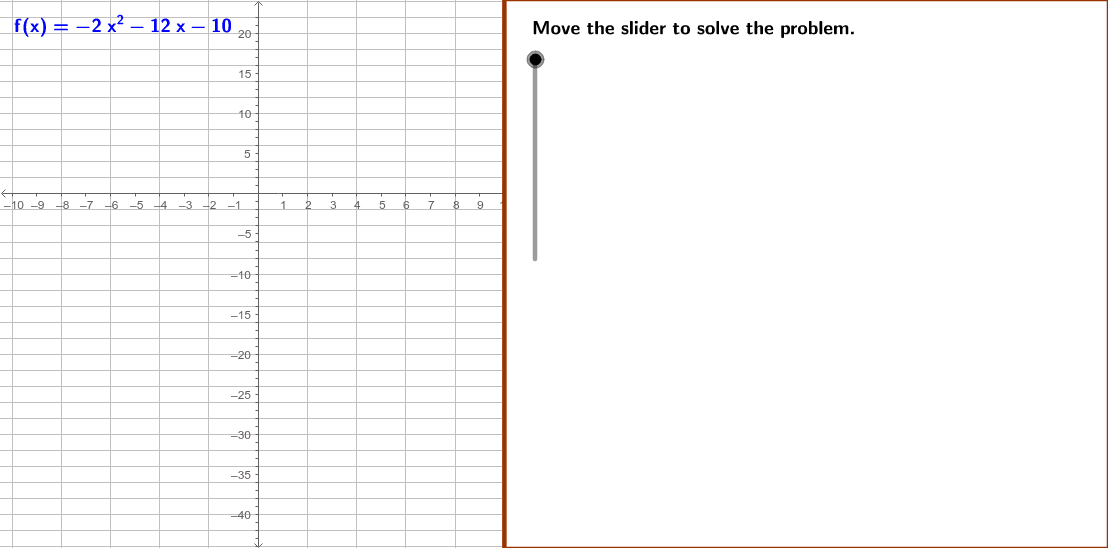
This example demonstrates the graph of the quadratic function f(x) = –2x^2 – 12x – 10, focusing on identifying its extremum, vertex, and y-intercept. Using GeoGebra commands such as Polygon, If, Factor, etc., these key features are clearly illustrated. Suitable for high school mathematics education and learning.
GeoGebra Commands & Parameters
Polygon((edge, y(Corner[1])), Corner[2], Corner[3], (edge, y(Corner[4]))) → Mask, mask1, mask2, mask4, mask3If(abs(c2) ≟ 1, If[c2 ≟ 1, "", "-"], LaTeX[c2]) → c1Factor(f) → fFactoredSegment(yInt, yIntR) → SegIntIf(Vx ≟ (-2), If[root2 ≟ -1, 1, -1], If[root1 ≟ (-2) ∨ root2 ≟ (-2), (2 * Vx) - root2, -2]) → x1Segment(P1, P2) → SegP1TableText({{"\textit{f}(\textit{x})=" + f + " ", "\text{Equation for }\textit{f}(\textit{x})"}, {"\textit{f}(0)= " + a + "(0)^2" + bA + "(0)" + cA + " ", "\text{Substitute 0 for }\textit{x}."}, {"\textit{f}(0)=" + c + " ", "\text{Simplify.}"}}, "c") → Conclusions5aTableText({{"\textit{x}=\frac{-\textit{b}}{2\textit{a}}", "\text{Formula to find the }\textit{x}\text{-coordinate}"}, {"\textit{x}=\frac{-(" + b + ")}{2(" + a + ")}", "\text{Substitute the values of }\textit{a}\text{ and }\textit{b}."}, {"\textit{x}=" + (((-b)) / ((2 * a))) + " ", "\text{Simplify.}"}}, "c") → Conclusions3b
AI Drawing Prompt Reference
Draw the graph of the quadratic function f(x) = –2x^2 – 12x – 10, highlighting its vertex, extremum, and y-intercept with a polygon, and display the factored form of the function and the step-by-step derivation of the vertex coordinates formula.
The prompt above was compiled from the original drawing commands and is for reference only.