
Jen's Age Function
Loading the math board and drawing, please wait…
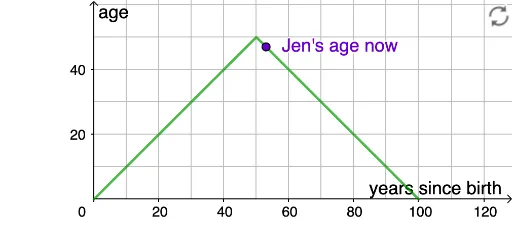
This example demonstrates Jen's age function. It involves concepts of function graphs, statistical characteristics, and step functions. Using GeoGebra commands for object j and point A, it dynamically shows the changes in the age function. Suitable for high school mathematics education and learning, especially for topics related to functions and statistics.
GeoGebra Commands & Parameters
j(x) = If[0 ≤ x ≤ 100, (-abs(x - 50)) + 50](53, 47)
AI Drawing Prompt Reference
Draw a function graph representing Jen's age changes. The age ranges from 0 to 100, reaching a maximum of 50 at age 50, and decreases by 1 for each additional or reduced year. Mark the points where Jen is currently 47 and 53 years old on the graph.
The prompt above was compiled from the original drawing commands and is for reference only.