
Investigation of Quadratic Function Transformations
Loading the math board and drawing, please wait…
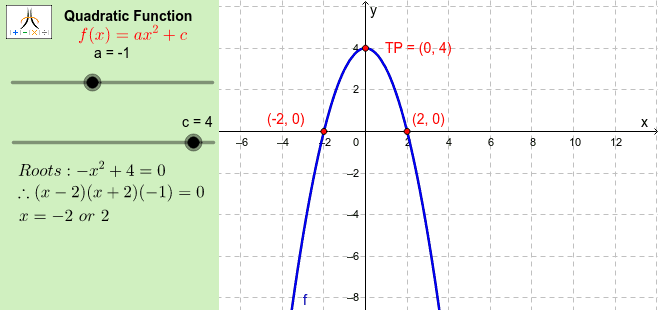
This interactive example demonstrates the vertical and horizontal transformations of quadratic functions. It focuses on core mathematical concepts including the vertex form, standard form, completing the square, finding extrema, and calculating roots. The construction utilizes GeoGebra commands such as CompleteSquare for algebraic manipulation, Extremum for vertex identification, and Root/Factors for x-intercept analysis. Additionally, it employs Polygon and Corner objects to create a structured UI panel and frame for better visualization. This tool is ideal for high school students and educators to explore the relationship between algebraic coefficients and geometric shifts.
GeoGebra Commands & Parameters
CompleteSquare(f) → CompSqExtremum(f) → TPRoot(f) → xints_1, xints_2Factors(f) → fctrsElement(fctrs, 1, 1) → fctr1Element(fctrs, 2, 1) → fctr2Element(fctrs, 3, 1) → fctr3Corner(1, 1) → Cnr1Corner(1, 2) → Cnr2Corner(1, 3) → Cnr3Corner(1, 4) → Cnr4Polygon(CN1, CN2, CN3, CN4) → Panel, cn1, cn2, cn3, cn4Polygon(Cnr1, Cnr2, Cnr3, Cnr4) → Frame, cnr1, cnr2, cnr3, cnr4
AI Drawing Prompt Reference
Draw a graph showing the transformations of a quadratic function. The graph should include key objects like the vertex, roots, and the parabola. The vertex should be marked as the highest or lowest point, and the roots should be shown on the x-axis. The parabola should demonstrate vertical and horizontal transformations. The graph should clearly show the relationships between these objects to help understand the geometric meaning of quadratic functions.
The prompt above was compiled from the original drawing commands and is for reference only.