
Introduction to Integration: Area Under a Curve
Loading the math board and drawing, please wait…
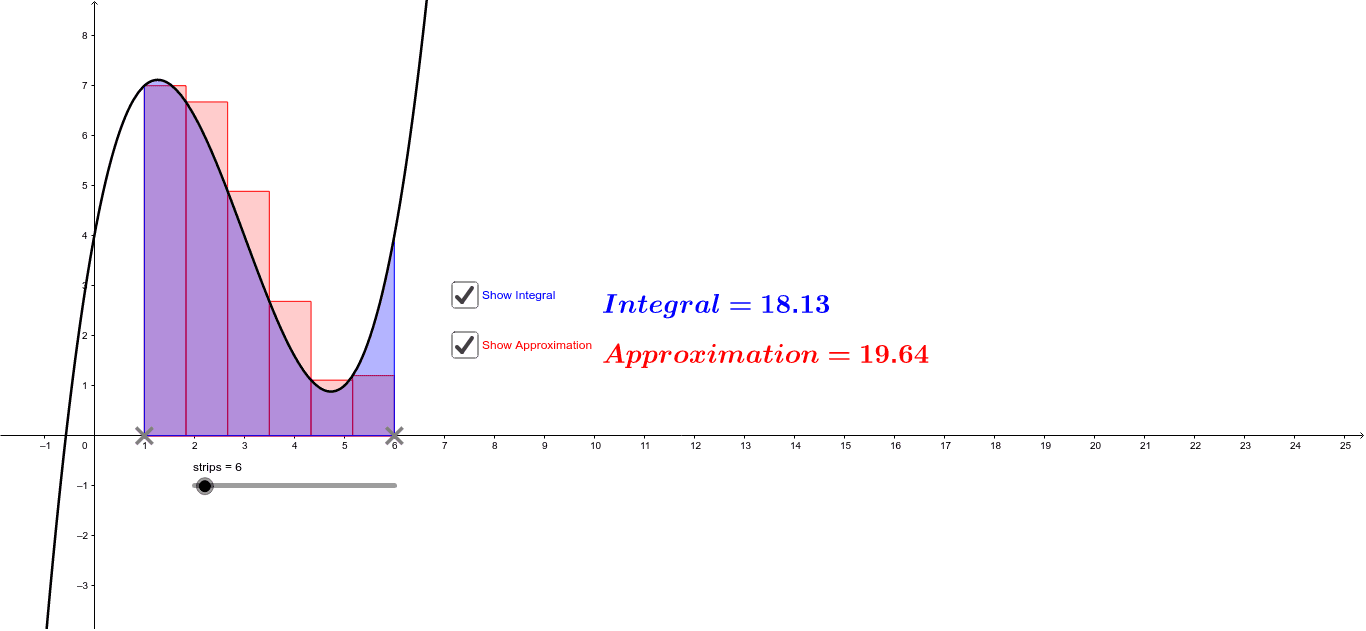
This example demonstrates how integration calculates the area under a curve by summing an infinite number of infinitesimal rectangles. The key mathematical concept is the integral, which accumulates small areas to find the exact value. Construction involves using GeoGebra commands like Point, Max, Min, Sequence, and Integral to define the function, boundaries, and rectangles. Suitable for high school students or college students learning calculus fundamentals, it helps understand the integral's basic idea.
GeoGebra Commands & Parameters
Point(xAxis) → APoint(xAxis) → BMax(x(A), x(B)) → maxMin(x(A), x(B)) → minSequence(Polygon[(min + ((k - 1) * width), 0), (min + ((k - 1) * width), f(min + ((k - 1) * width))), (min + (k * width), f(min + ((k - 1) * width))), (min + (k * width), 0)], k, 1, strips) → list1Integral(f, min, max) → a
AI Drawing Prompt Reference
Draw a curve and plot multiple rectangles below it, evenly distributed from the lowest to the highest point of the curve, each with equal width and height equal to the function value at the corresponding point. The sum of the areas of all rectangles under the curve represents the integral area. First determine the horizontal range of the curve, then draw the rectangles within this range, and finally use the integral symbol to represent the total area under the curve.
The prompt above was compiled from the original drawing commands and is for reference only.