
Introduction to Covariance and Correlation
Loading the math board and drawing, please wait…
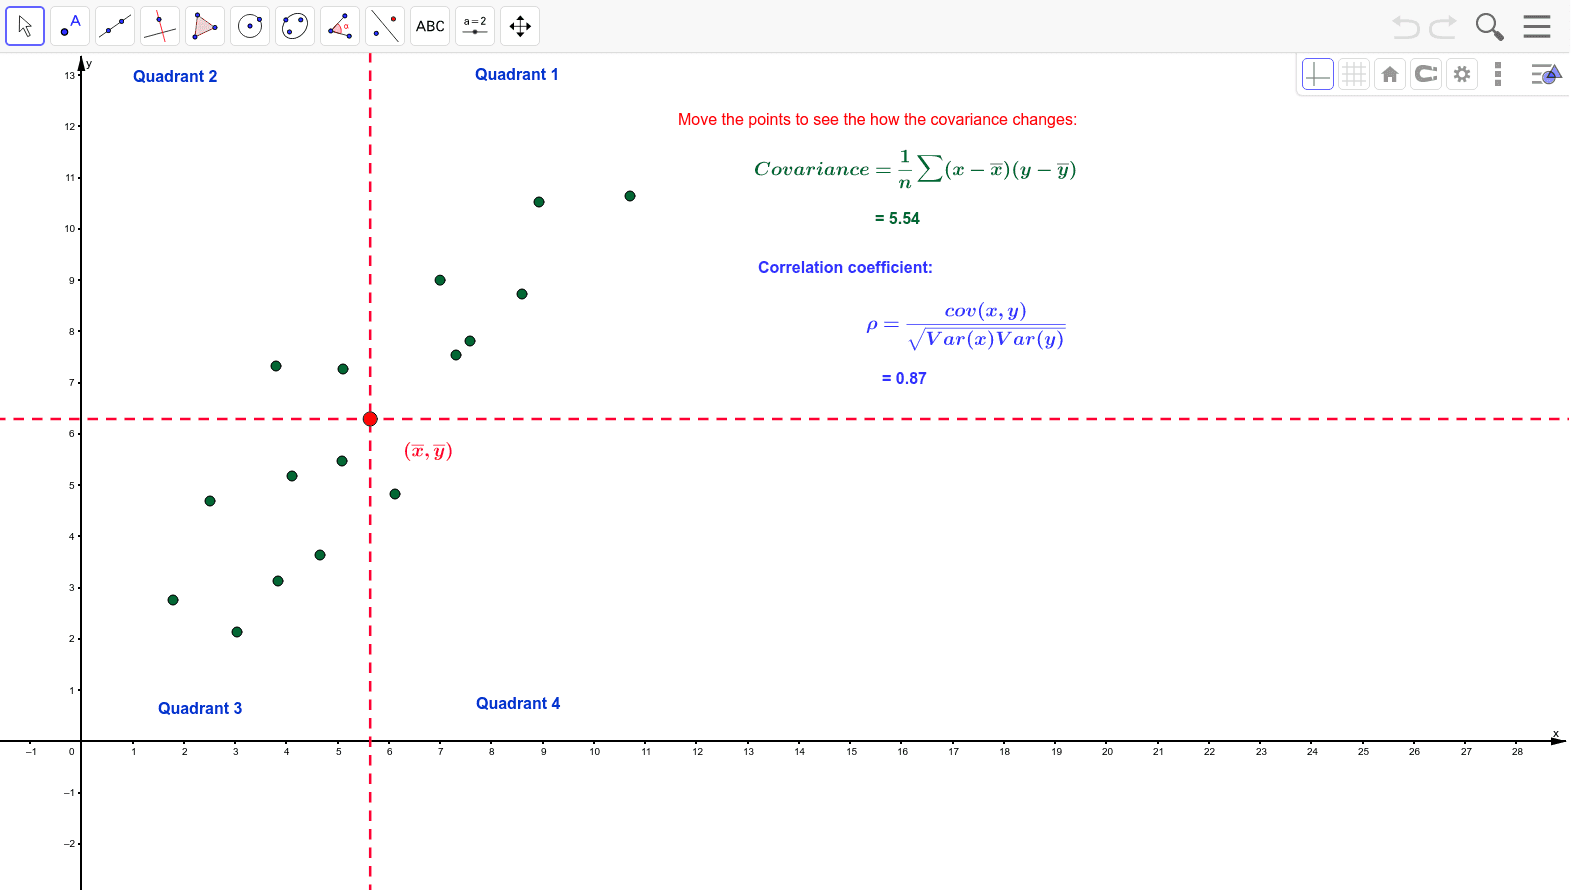
This example demonstrates how to visually understand the concepts of covariance and correlation through scatter plots; core math concepts include covariance, correlation, scatter plots, and data distribution; construction highlights involve commands like MeanY, MeanX for mean calculation, Covariance for covariance, PMCC for correlation, with objects A1-B16, A-G; suitable for high school and above students learning probability statistics to grasp data correlation.
GeoGebra Commands & Parameters
MeanY(list1) → bMeanX(list1) → aCovariance(list1) → ePMCC(list1) → f