
Introducing Derivatives via the Slope Function
Loading the math board and drawing, please wait…
In collections
Learn GeoGebra Classic
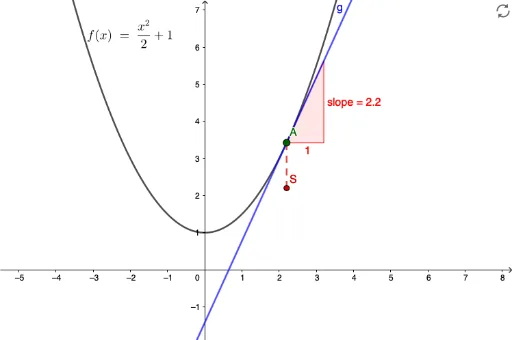
① This example dynamically shows how the slope of a tangent line changes along a function's graph, visually introducing the derivative as a slope function. ② Core mathematical concepts include the geometric definition of the derivative, tangent slope, rate of change, and the relationship between a quadratic function and its derivative. ③ Construction highlights: using GeoGebra commands Point to place a movable point A on function f, Tangent to create the tangent line, Slope to compute its slope and plot the slope function g, and Segment with points S and h to visualize the slope value as a segment. ④ Suitable for high school or early college calculus students, this interactive tool helps bridge the gap from average to instantaneous rate of change and serves as an effective classroom demonstration for building intuitive understanding of derivatives.
GeoGebra Commands & Parameters
Point(f) → ATangent(A, f) → gSlope(g) → slopeSegment(S, A) → h
AI Drawing Prompt Reference
Draw a dynamic illustration showing how the slope of a tangent line changes along a function's graph. Use a movable point on the function to create a tangent line, calculate its slope, and plot this slope as a new function. Also, visualize the slope value as a line segment to demonstrate the geometric definition of the derivative and the relationship between the function and its derivative.
The prompt above was compiled from the original drawing commands and is for reference only.