
Interactive Riemann Sums and Trapezoidal Approximation of Definite Integrals
Loading the math board and drawing, please wait…
This example demonstrates how upper and lower Riemann sums and trapezoidal approximations estimate the definite integral of a function by partitioning an interval and constructing approximate rectangles or trapezoids on a graph. It covers functions, linear equations, interval partitioning, upper and lower sums, trapezoidal approximation, definite integrals, and scatter plots. The construction uses GeoGebra commands such as Segment to draw curve or partition segments, Polygon to create approximate area shapes, Slider to control xMin, xMax, yMin, yMax and related parameters, Toggle1 and Toggle2 to switch approximation modes, SelectedElement for interactive selection, and LaTeX for formula labels; buttons and interface objects support reset, randomization, and panel toggling. It is suitable for high-school or introductory calculus courses and for visualizing numerical integration and area approximation.
GeoGebra Commands & Parameters
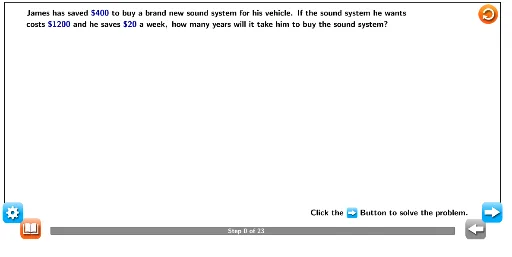
SelectedElement(S1) → s1SelectedElement(T1) → t1LaTeX((((("\text{James has saved \textcolor{#000099}{\textdollar{" * s1) * "}} to buy a brand new sound system for his vehicle. If the sound system he wants\\costs \textcolor{#000099}{\textdollar{") * t1) * "}} and he saves \textcolor{#000099}{\textdollar20} a week, how many years will it take him to buy the sound system?}")) → text1LaTeX("\text{Read the problem carefully.}") → text2LaTeX("\text{Reread the scenario and make a list of the known quantities.}") → text2_2LaTeX("\text{Reread the problem again, identify the unknown quantity or variable. The scenario asks for the number of years.\\This is tricky because the quantity is given in terms of weeks. The variable to solve for first, then, is weeks.}") → text2_4LaTeX((((("\text{The sound system costs \textcolor{#000099}{\textdollar{" * t1) * "}}. James has already saved \textcolor{#000099}{\textdollar{") * s1) * "}}. James will continue to save \textcolor{#000099}{\textdollar20} per week.}")) → text2_1LaTeX("\text{Create an equation from the known quantities and variable(s).}") → text2_3LaTeX((("\text{James’s goal is to save \textcolor{#000099}{\textdollar{" * t1) * "}}.}")) → text3LaTeX((("\text{James has saved \textcolor{#000099}{\textdollar{" * s1) * "}} so far and has to save more to reach his goal.")) → text2_5LaTeX("\text{Solve the equation for the variable.}") → text2_9LaTeX((("\text{_______\textcolor{#000099}{ = {" * t1) * "}}}")) → text2_6LaTeX((((("\text{\textcolor{#000099}{{" * s1) * "} + }______ \textcolor{#000099}{= {") * t1) * "}}}")) → text2_8LaTeX((("\text{\textcolor{#000099}{−{" * s1) * "}}}")) → text2_{14}LaTeX((("\text{\textcolor{#000099}{−{" * s1) * "}}}")) → text2_{11}Segment(C, D) → fLaTeX("\text{Interpret the solution in the context of the problem and convert to the appropriate units if necessary.}") → text2_{15}LaTeX("\text{\textcolor{#000099}{\frac{1\;year}{52\;weeks}}}") → text2_{17}LaTeX((("\text{\textcolor{#000099}{{" * week) * "} weeks \cdot \frac{1\;year}{52\;weeks}}}")) → text2_{20}LaTeX((((("\text{\textcolor{#000099}{{" * week) * "} weeks \cdot \frac{1\;year}{52\;weeks}≈{") * sol) * "}\; years}}")) → text2_{19}LaTeX("\text{James saved \textdollar}") → text5LaTeX("\text{Sound system Costs \textdollar}") → text5_2LaTeX((("\text{Step {" * Slider) * "} of 23}")) → text6LaTeX((((("\text{\textcolor{#000099}{{" * s1) * "} + 20\mathit{x} = {") * t1) * "}}}")) → text2_{10}LaTeX((((("\text{\textcolor{#000099}{{{" * s1) * "}+20\mathit{x}={") * t1) * "}}}")) → text2_{12}LaTeX((("\text{\textcolor{#000099}{20\mathit{x}={" * sub) * "}}}")) → text2_{13}LaTeX((("\text{\textcolor{#000099}{\frac{20\mathit{x}}{20}=\frac{{" * sub) * "}}{20}}}")) → text4LaTeX((("\text{\textcolor{#000099}{\mathit{x}={" * week) * "}}}")) → text2_{16}LaTeX("\text{James is saving \textcolor{#000099}{\textdollar20} a week for some unknown number of weeks to reach his goal. Let \textcolor{#000099}{\mathit{x}} represent the number of weeks.}") → text2_7LaTeX("\text{In the equation, \textcolor{#000099}{\mathit{x}} represents weeks. The problem statement asks for the number of years it will take James\\to save for the sound system, so convert weeks to years. There are \textcolor{#000099}{52} weeks in a year.}") → text2_{18}Segment(E, F) → gSegment(G, H) → hLaTeX("\text{2}") → text7LaTeX("\text{3}") → text8LaTeX("\text{1}") → text9LaTeX("\text{4}") → text10LaTeX((("\text{James will need to save for approximately \textcolor{#000099}{{" * sol) * "}} years, a little more than quarters of the year,\\to pay for the new sound system.}")) → text2_{22}LaTeX("\text{The amount or number of a material or abstract thing not\\usually estimated by spatial measurement.}") → text12_3LaTeX("\text{Each of four equal or corresponding parts into which something\\is or can be divided.}") → text12LaTeX("\text{\textbf{Quantity:}}") → text12_1LaTeX("\text{\textbf{Quarter:}}") → text12_2Polygon(L, M, N, O) → poly1, l, m, n, o_1LaTeX("\text{“}") → text14LaTeX("\text{“}") → text14_2LaTeX("\text{Click the Button to solve the problem.}") → text11LaTeX("\text{\mathbf{Note:}“Use the (Data Kit) \\to return to the original problem \\or randomly generate a similar \\practice problem.\;\;and\;“Use \\the (Definition) to review\\words to know.}") → text13
AI Drawing Prompt Reference
Draw a function graph showing the process of estimating a definite integral using upper and lower Riemann sums and trapezoidal approximation. First, draw the function curve, then use rectangles and trapezoids to approximate the integral. Use sliders to control interval partitioning and switch between upper and lower sum modes. Interactively select elements to demonstrate the approximation process. Display a randomly generated function graph and show the numerical approximation of the integral.
The prompt above was compiled from the original drawing commands and is for reference only.