
Interactive Logarithmic Function Parameter Demo
Loading the math board and drawing, please wait…
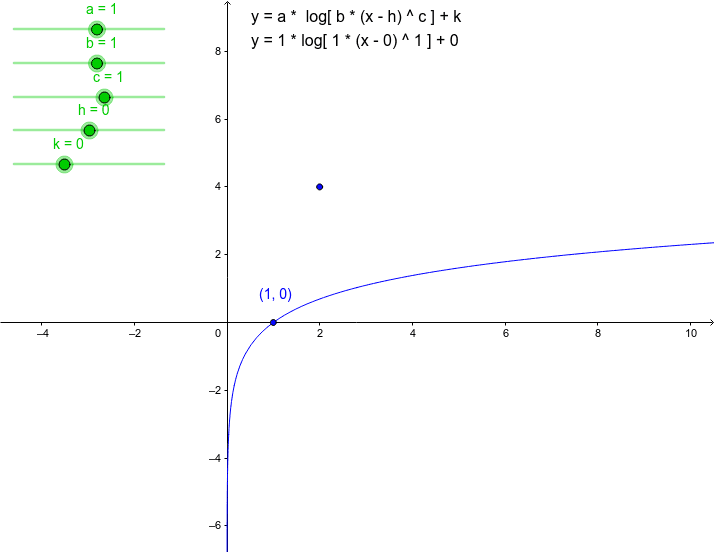
This GeoGebra applet demonstrates how varying parameters affect the logarithmic function graph. Users can adjust sliders for k (vertical scaling), a (base-related), h (horizontal shift), and c (vertical shift) to observe real-time transformations of f(x)=k·log(a(x-h))+c. The construction includes parameter sliders k, a, h, c, function f, text labels, and Y-axis. Ideal for high school mathematics teaching, helping students understand graphical transformations of logarithmic functions and the geometric meaning of parameters when base > 0 and base ≠ 1.
GeoGebra Commands & Parameters
Numeric k(0.0)Numeric a(1.0)Numeric h(0.0)Point A(2.0, 4.0)Numeric b(1.0)Numeric c(1.0)f(x) = (a * log((b * (x - h)^(c)))) + k((1 / b)^(1 / c) + h, k)