
Sine Function Transformations: Translation and Dilation
Loading the math board and drawing, please wait…
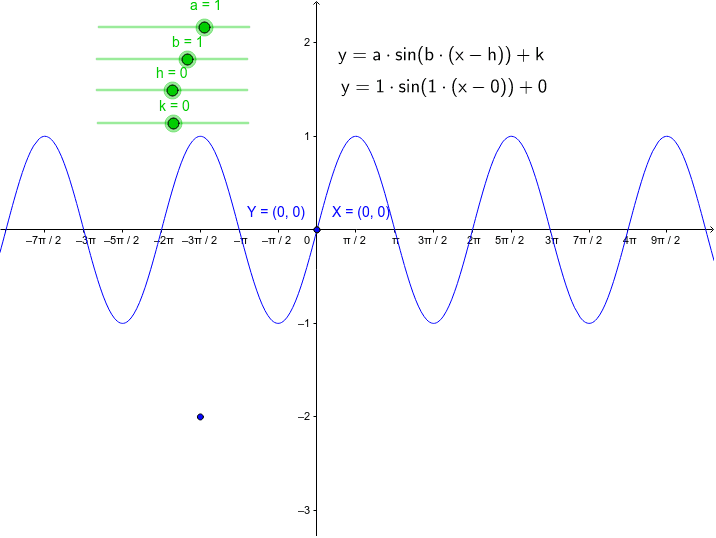
This interactive GeoGebra worksheet demonstrates the transformations of the sine function y=a·sin(b(x-h))+k. Users can manipulate sliders to adjust parameters a (amplitude), b (period), h (horizontal shift), and k (vertical shift), observing how the graph stretches, compresses, and translates in real-time. Key mathematical concepts include amplitude, period, phase shift, and the geometric interpretation of function transformations. Construction: Create sliders for parameters a, b, h, k; use the Function command to define f(x)=a*sin(b*(x-h))+k; add dynamic text to display parameter values and the function equation; label axes and key points. Ideal for high school trigonometry courses and introductory college mathematics, suitable for classroom demonstration, student exploration, or homework assignments.
GeoGebra Commands & Parameters
Numeric k(0.0)Numeric a(1.0)Numeric b(1.0)Numeric h(7.923062206316445E-8)(0, (a * sin(((-b) * h))) + k)f(x) = (a * sin((b * (x - h)))) + k(asin(((-k)) / a) / b + h, 0)Point A(-4.71238898038469, -2.0)
AI Drawing Prompt Reference
Draw a sine function graph with sliders for parameters a, b, h, k to observe transformations of y=a·sin(b(x-h))+k, showing effects on amplitude, period, phase shift, and vertical shift, label axes and key points, and dynamically display parameter values and function equation.
The prompt above was compiled from the original drawing commands and is for reference only.