
Interactive Fractions Division Demonstration with Circular Visualization
Loading the math board and drawing, please wait…
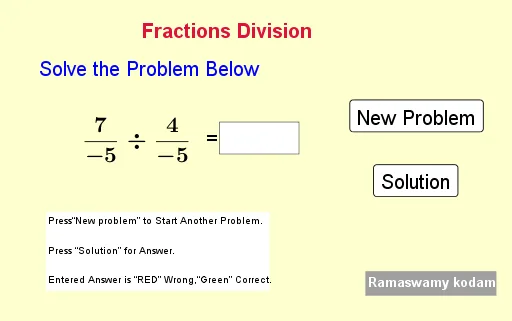
This GeoGebra example demonstrates the dynamic computation of fraction division and its visualization through circular models. Core mathematical concepts include fraction division, multiplication by reciprocals, equivalent fractions, and proportional area representation. The construction uses GeoGebra commands Random and RandomElement to generate random fraction operands, FractionText to display fractional notation, Textfield and InputBox1 for user input, and button1/button2 to control interactive steps. Relevant objects include variables a through k, l1, m, n, and text labels text1 through text8. It is suitable for upper elementary and middle school mathematics instruction, classroom demonstrations, and independent student practice.
GeoGebra Commands & Parameters
Random(1, 10) → aRandom(1, 10) → cRandomElement(l1) → bRandomElement(l1) → dFractionText(g) → text3Textfield(n) → InputBox1FractionText(k) → text8
AI Drawing Prompt Reference
Draw a circle to demonstrate dynamic fraction division. First, draw two circles representing fractions a/b and c/d. Use an input box for the user to enter the divisor, then calculate and display the quotient. Use text labels to show the fractions and calculation results, including equivalent fractions and area representation.
The prompt above was compiled from the original drawing commands and is for reference only.