
Interactive Exploration of Graph Transformations (KS4/KS5)
Loading the math board and drawing, please wait…
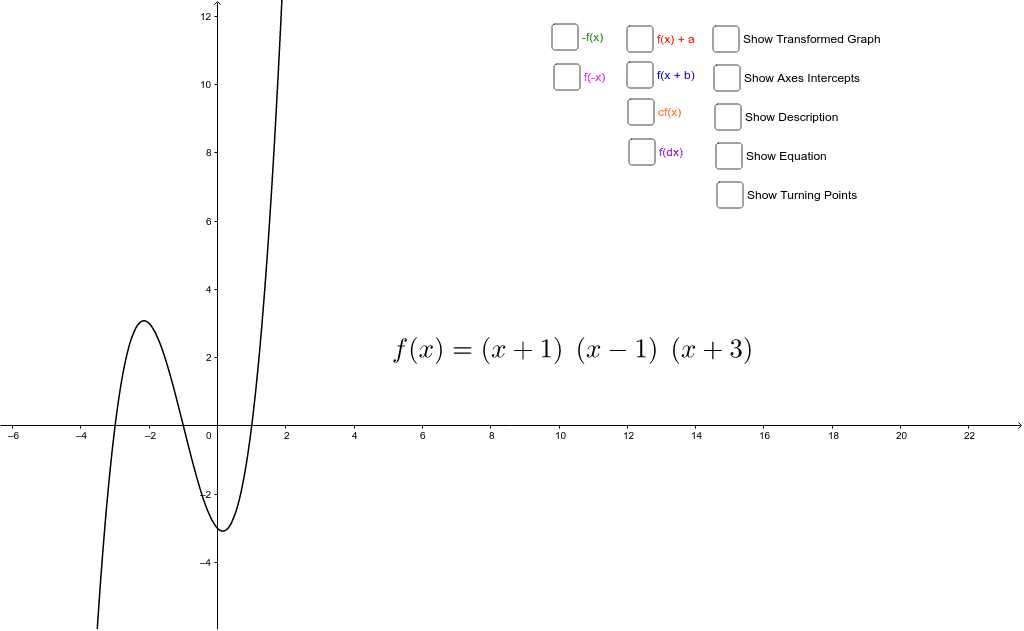
This GeoGebra example provides an interactive environment for understanding transformations of function graphs, such as vertical/horizontal shifts, stretches, compressions, and reflections. It is designed for KS4 or KS5 students (UK secondary and A-level) to explore how changing parameters in expressions like f(x)+a, f(x+b), af(x), and f(ax) affects the graph. The construction uses the Intersect command to find key points, a Textfield input box to dynamically change the function equation, and the Extremum command to mark local maxima/minima. Multiple function objects (f, f_1, f_2, f_3, f_4) with parameters (a, b, c, d) are defined, along with numerous text labels (text1–text10) explaining each transformation rule. Additional geometric shapes such as equilateral triangles and parallelograms are included to support visual reasoning. This resource is ideal for classroom demonstration or self-study, helping students grasp the algebraic-geometric connection behind graph transformations.
GeoGebra Commands & Parameters
Intersect(f_1, yAxis) → AIntersect(f_1, xAxis) → B, C, DIntersect(f_2, yAxis) → EIntersect(f_2, xAxis) → F, G, HIntersect(f_3, yAxis) → IIntersect(f_3, xAxis) → J, K, LIntersect(f_4, yAxis) → MIntersect(f_4, xAxis) → N, O, PTextfield(f) → inputBox1Intersect(f_5, yAxis) → QIntersect(f_6, yAxis) → UIntersect(f_6, xAxis) → V, W, ZIntersect(f, yAxis) → A_1Intersect(f, xAxis) → B_1, C_1, D_1Extremum(f) → TP1, TP2Extremum(f_1) → TP1_1, TP2_1Extremum(f_2) → TP1_2, TP2_2Extremum(f_3) → TP1_3, TP2_3Extremum(f_4) → TP1_4, TP2_4Extremum(f_5) → TP1_5, TP2_5Extremum(f_6) → TP1_6, TP2_6
AI Drawing Prompt Reference
Create an interactive graph exploration showing a base function curve and six transformed versions representing vertical/horizontal shifts, stretches, compressions, and reflections. Mark intersections of each curve with the axes using points, and highlight local extrema with distinct markers. Include an input box to dynamically change the base function equation. Add text labels explaining each transformation rule, and include geometric shapes like equilateral triangles and parallelograms to support visual reasoning. The layout should be clear for classroom demonstration or self-study, emphasizing the connection between algebraic expressions and graph changes.
The prompt above was compiled from the original drawing commands and is for reference only.