
Interactive Expected Value of Complex Logarithmic Integrals
Loading the math board and drawing, please wait…
In collections
Mapping Diagrams: From AB to C&DE, Resource
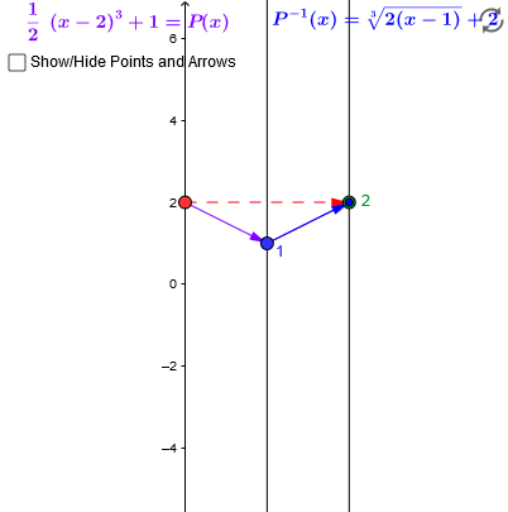
① This GeoGebra example demonstrates an interactive visualization of expected value calculations involving complex numbers, natural logarithmic functions, and indefinite integrals, with parameters adjustable via sliders and input boxes. ② Core mathematical concepts include complex number operations, indefinite integrals, natural logarithms, expected value, and summation over natural numbers, bridging discrete sequences and continuous functions. ③ Construction highlights: uses commands such as Point, Vector, Textfield, and Sequence; creates multiple points (A1–A12, B1–B3), functions f and g, vector v, sequences list1 and list2_2, and displays dynamic formulas via input boxes (inputBox1/inputBox2) and text objects (text1, text3, text4, text5). ④ Suitable for high school to early college students, this example helps explore the interplay between complex analysis, calculus, and probability, and serves as a template for educators building interactive lessons on integrals or complex-valued expectations.
GeoGebra Commands & Parameters
Point(yAxis) → XVector(X, B) → fVector(B, C) → gTextfield(f_2) → inputBox1Textfield(g_2) → inputBox2Vector(B, D) → vVector(X, C) → uSequence(Vector[(2, i), (4, g_2(i))], i, -3, 7) → list2_2Sequence((i, g_2(i)), i, -3, 7) → list1
AI Drawing Prompt Reference
Create an interactive visualization showing expected value calculations involving complex numbers, natural logarithmic functions, and indefinite integrals. Adjust parameters with sliders and input boxes. Display multiple points and vectors, such as X, f, g, v, and u, along with dynamic formulas generated by input boxes. Construct two sequences, list1 and list2_2, representing function values and vectors, and show their relationships.
The prompt above was compiled from the original drawing commands and is for reference only.