
Interactive Demonstration of Dynamic Polynomial Functions and Vector Sequences
Loading the math board and drawing, please wait…
In collections
Mapping Diagrams: From AB to C&DE, Resource
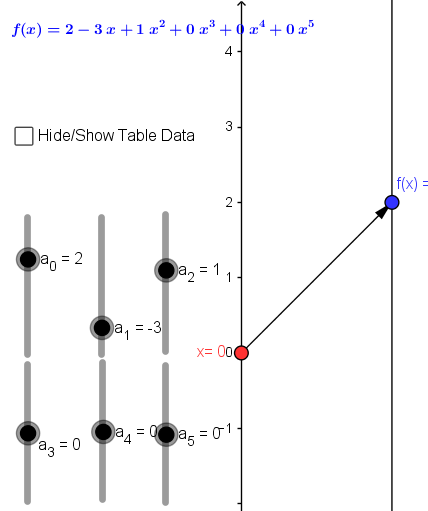
This GeoGebra example constructs an interactive environment combining polynomial functions, vector sequences, and input fields, allowing users to adjust function parameters in real time and observe corresponding point sequences. The core mathematical concepts include polynomial function graphs and coefficient relationships, geometric representation of vectors, generation of sequences, and conic sections such as parabolas. Construction details involve using the Point command to create key points, Vector for drawing vectors, Textfield and inputBox1 for parameter input, Sequence to generate point sets A2-A14 and B2-B12, and the function f with objects a, a_0 to a_5 to control polynomial coefficients. This resource is suitable for high school or early college students to explore function transformations, vector operations, and sequence patterns intuitively, and serves as an effective tool for classroom demonstrations or self-directed learning.
GeoGebra Commands & Parameters
Point(yAxis) → A_1Vector(A_1, B) → uTextfield(f) → inputBox1Sequence((k, f(k)), k, -3, 3, 0.5) → list2Sequence(Vector[(0, k), (2, f(k))], k, -3, 3, 0.5) → list1
AI Drawing Prompt Reference
Create a coordinate system with a polynomial function graph and an input box for adjusting its coefficients. Mark a key point on the y-axis and draw a vector from that point to another reference point. Along the function curve, generate a sequence of points from x = -3 to 3 in steps of 0.5, and draw vertical vectors from the x-axis at each corresponding x-value up to the function point. Include a text field for parameter input to dynamically change the function and the resulting point and vector sequences.
The prompt above was compiled from the original drawing commands and is for reference only.