
Interactive Construction of Exponential Function and Derivative: CCD.DDF.1
Loading the math board and drawing, please wait…
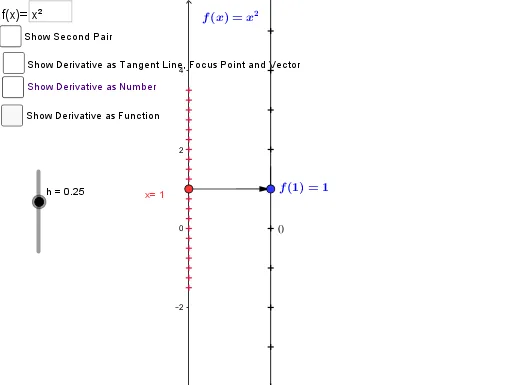
This GeoGebra example demonstrates the dynamic construction of an exponential function and its derivative, incorporating concepts of LCM and GCD. The core mathematical concepts include exponential functions, derivatives, function graphs, and geometric elements such as points, lines, and vectors. The construction uses GeoGebra commands: Point, Vector, Textfield, Segment, Line, Derivative, Intersect, Sequence, and Zip, creating objects like the function f, its derivative f', intersection points, text input boxes, buttons, and sliders for interactive parameter adjustment. Suitable for high school and above, this example aids in learning introductory calculus and function transformations, and serves as a classroom demonstration tool to visualize the relationship between a function and its rate of change.
GeoGebra Commands & Parameters
Point(yAxis) → AVector(A, B) → f_vTextfield(f) → inputBox1Vector(x_1, y_1) → vSegment(f_x, F) → cSegment(E, F) → dSegment(A, x_1) → eSegment(B, y_1) → gSegment(B, y_1) → h_1Line(x_1, y_1) → iLine(A, B) → kTextfield(f) → inputBox2Derivative(f) → f'Vector(B, C) → uLine(C, D) → bIntersect(b, k) → FocusLine(x_1, y_1) → nLine(A, B) → pIntersect(n, p) → GSequence(n, n, -10, 10) → numZip((2, n), n, num) → n_yZip((4, n), n, num) → z_hVector(A, H) → wSegment(f_x, E) → mPoint(q) → JSegment(B, J) → rPoint(B, u) → KSegment(K, H) → sZip((0, y(A) + (h * c)), c, num) → x_hZip((2, f(y(A) + (h * c))), c, num) → y_hZip(Vector[(0, y(A) + (h * c)), (4, f'(y(A) + (h * c)))], c, num) → df_hZip(Vector[(0, y(A) + (h * c)), (2, f(y(A) + (h * c)))], c, num) → f_hZip((y(A) + (h * c), f'(y(A) + (h * c))), c, num) → ptdf_h
AI Drawing Prompt Reference
Create a dynamic geometric diagram illustrating an exponential function and its derivative. Start by plotting the exponential curve on a coordinate plane, marking a point on the curve and its tangent line. Place a movable point on the y-axis, from which a vector extends to represent input variation. Include a text input box for the function expression and sliders for parameter adjustment. Draw the derivative curve, and from points on the y-axis, show horizontal vectors pointing to the function values and derivative values at corresponding x-coordinates, enabling visual comparison. Also construct auxiliary segments and intersection points to highlight geometric relationships.
The prompt above was compiled from the original drawing commands and is for reference only.