
Graphing a Function with Slope Value and Tangent Line
Loading the math board and drawing, please wait…
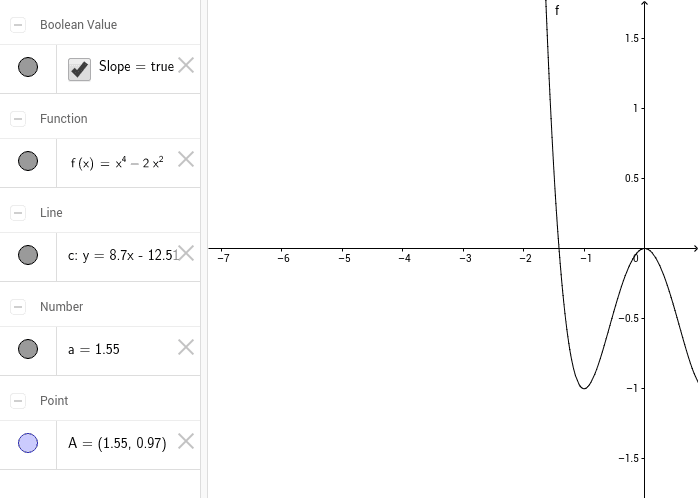
① This GeoGebra example dynamically displays a function graph along with its tangent line at a movable point, showing the slope value in real time to illustrate the geometric meaning of derivatives. ② Core mathematical concepts include function graphing, tangent lines, slope (derivative), and the effect of input parameters on the graph, involving linear equations and visual reasoning. ③ Construction highlights: a Textfield input box for entering the function expression, the Tangent command to create the tangent at a chosen point, the Slope command to compute and display the slope value, and a slider or input box to adjust the point of tangency for interactive exploration. ④ Suitable for high school and early college students learning calculus, ideal for classroom demonstrations or self-study of derivative concepts, and serves as a reusable template for teachers building interactive lessons.
GeoGebra Commands & Parameters
Textfield(f) → inputBox1Tangent(A, f) → c
AI Drawing Prompt Reference
Draw a function graph and a tangent line at any point on the graph, showing the slope value at that point. First, input the function expression, then drag a point on the graph to automatically draw the tangent line at that point and display the slope value.
The prompt above was compiled from the original drawing commands and is for reference only.