
Interactive Bar Chart and Linear Equation Demo
Loading the math board and drawing, please wait…
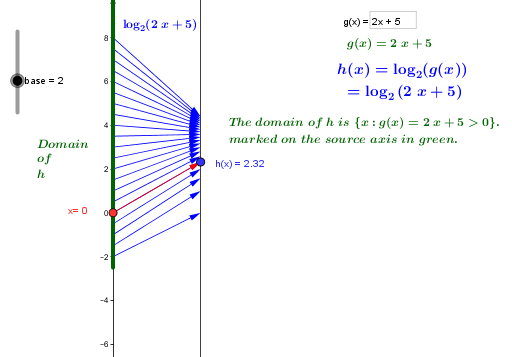
This example demonstrates the relationship between bar charts, linear equations, and percentage calculations through an interactive interface; Core math concepts include bar chart construction, arithmetic operations, linear equation solving, trigonometric function application, and percentage conversion; GeoGebra commands/objects used in construction are Point, Vector, Textfield, Ray, Intersect, Rotate, Translate, and Sequence; Suitable for middle school and above mathematics education, visualizing function understanding and geometric transformations.
GeoGebra Commands & Parameters
Point(yAxis) → A_1Vector(A_1, B) → uTextfield(h) → inputBox1Point(yAxis) → EPoint(yAxis) → FRay(E, F) → lIntersect(xAxis, yAxis) → GRay(G, H) → mTextfield(g) → inputBox2Rotate(dom, 90°, (0, 0)) → dom_1Vector((0, 0), (-2, 0)) → vTranslate(dom_1, v) → cSequence((k, h(k)), k, -8, 8, 0.5) → GraphptsSequence(Vector[(0, k), (2, h(k))], k, -8, 8, 0.5) → MDlogSequence(Vector[(0, k), (2, h(k))], k, -8, 8, 0.5) → MD_g
AI Drawing Prompt Reference
Create an interactive bar chart and linear equation demo. Place two input boxes on the coordinate axes to control a function and a parameter. Draw a ray from two points on the y-axis, and another ray from the origin along the x-axis, intersecting the first. Rotate a function graph 90 degrees around the origin, then translate it left by two units to form a new curve. Generate a sequence of points for x from -8 to 8 with step 0.5, and draw horizontal vectors from the y-axis to the function values, representing bar heights. Show the relationship between functions, geometric transformations, and percentage calculations.
The prompt above was compiled from the original drawing commands and is for reference only.