
Integration Introduction: Formula Display and Construction
Loading the math board and drawing, please wait…
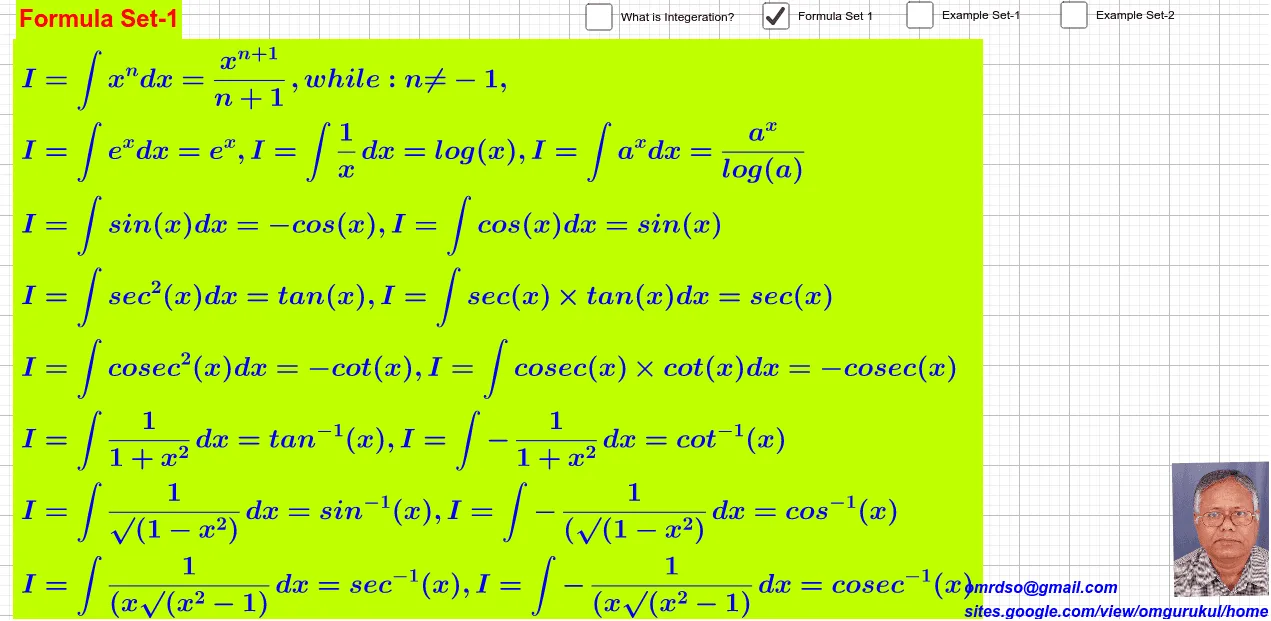
This GeoGebra example demonstrates the fundamental concepts of integration, presenting the integral formula and its visual representation. It covers definite and indefinite integrals, the integral sign with limits, and the relationship between integration and area under a curve. The construction uses text objects (text1 to text11) to display formulas and explanations, variables a, b, c, d, points A and B for graphical elements, and an image pic1 for supplementary illustration. Suitable for high school or early college students beginning calculus, this resource aids in classroom teaching or self-study of integration basics.
GeoGebra Commands & Parameters
Boolean a(true)Boolean b(false)Boolean c(false)Boolean d(false)Point A(19.1, -5.64)Point B(21.28, -5.6)
AI Drawing Prompt Reference
Draw an integral graph of a function, including concepts of definite and indefinite integrals. Use points A and B as the endpoints of the integration interval, and display the integral sign with limits. Show integral formulas and explanations using text objects, including the relationship between integration and the area under the curve.
The prompt above was compiled from the original drawing commands and is for reference only.