
Integrated Sequence, Vector, Calculus and Probability Demo
Loading the math board and drawing, please wait…
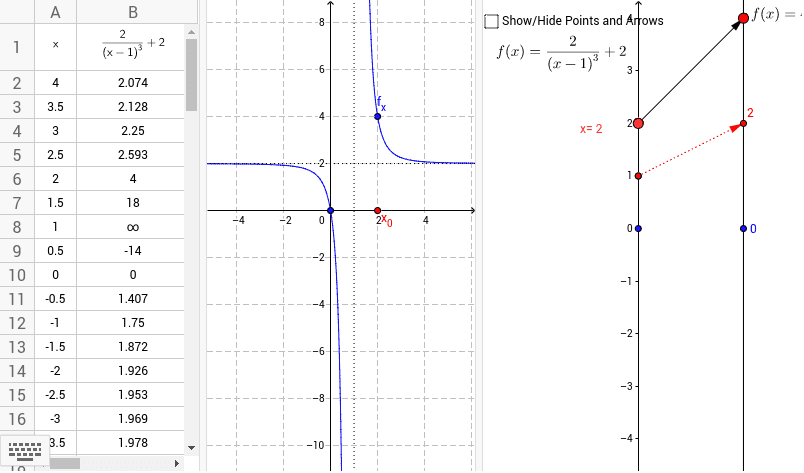
①This GeoGebra example demonstrates an interactive mathematical experiment combining sequences, vectors, calculus, and probability concepts. ②Core mathematical ideas include sequence limits, definite integral approximation, vector operations, secant line slopes, and probability distributions, linking functions, sequences, vectors, and integrals. ③Construction highlights: using commands like Point, Vector, Textfield, and Sequence to create dynamic objects such as points a_n, vector u, and input box inputBox1, with sliders k and h controlling parameters, generating sequence terms, secant lines, integral approximations, and probability-related elements, involving objects A, B, G1, H1 and multiple auxiliary points. ④Suitable for high school to undergraduate mathematics education, helping students visualize convergence, integral approximation, vector geometry, and probabilistic connections, and serving as an inquiry-based learning tool.
GeoGebra Commands & Parameters
Point(yAxis) → AVector(A, B) → uTextfield(f) → inputBox1Vector((0, 0), (2, 0)) → vVector(H, I) → wVector(J, K) → zSequence(Vector[(0, i), (2, f(i))], i, -4, 4, 0.5) → list2Sequence((i, f(i)), i, -4, 4, 0.5) → list3
AI Drawing Prompt Reference
Draw a mathematical demonstration showing the integration of sequences, vectors, calculus, and probability. Include a point along the y-axis, a vector from this point to another, an input box for a function, a fixed vector, two dynamic vectors, and two sequences: one generating points, the other generating points corresponding to function values, ranging from -4 to 4 in increments of 0.5, connected by line segments to form the function graph and sequence plot.
The prompt above was compiled from the original drawing commands and is for reference only.