
Confidence Interval Dynamic Demonstration (Normal & Binomial)
Loading the math board and drawing, please wait…
In collections
Probability distributions with GeoGebra
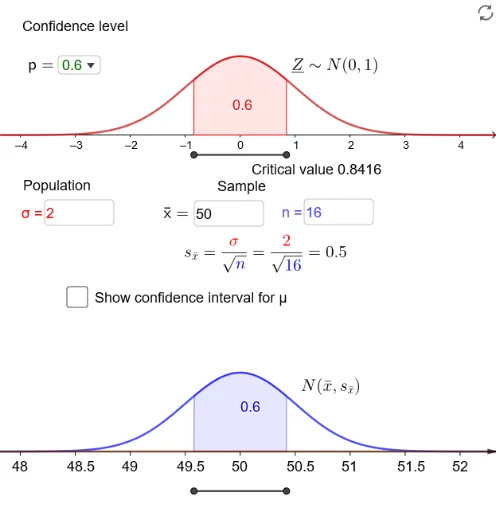
① This GeoGebra example interactively demonstrates the construction and visualization of confidence intervals in statistics, allowing users to adjust parameters such as sample size, mean, and standard deviation to observe how the interval coverage changes under the normal distribution curve. ② Core mathematical concepts include confidence intervals, normal distribution, binomial distribution, standard error, significance level α, and the central limit theorem, focusing on interval estimation in probability and statistics. ③ Construction highlights: uses commands like If, Textfield, SelectedElement to create input controls; Normal and InverseNormal for critical values; Integral and IntegralBetween for probability areas; Segment, Sequence, Vector for drawing intervals and sampling distributions; Translate for shifting graphics; and multiple text objects (teksti1~teksti12) to dynamically display numerical results. ④ Suitable for high school to university-level statistics teaching, especially for classroom demonstrations or student exploration of the relationship between confidence level, margin of error, and sample size.
GeoGebra Commands & Parameters
If(lg(sx) > 0, 1, ceil((-lg(sx)))) → pyorTextfield(σ) → tekstikenttä1Textfield(ka) → tekstikenttä2Textfield(n) → tekstikenttä3SelectedElement(p) → valNormal(0, 1, x, false) → fInverseNormal(0, 1, val + α / 2) → aIntegral(f, (-a), a) → bSegment(B, A) → iSequence(round(ka + (k * sx), pyor), k, -5, 5) → teVector(C, D) → uIntegralBetween(g, h, ala, yla) → cIntegralBetween(g, h, (-a), a) → eTranslate(B, (0, -1.7)) → B'Translate(A, (0, -1.7)) → A'Segment(B', A') → i'Sequence(Segment[((Element[te, k] - ka) / sx, -1.6), ((Element[te, k] - ka) / sx, -1.62)], k, 1, Length[te]) → l2Sequence(Text[Element[te, k], (k - 6.15, -1.7)], k, 1, 11) → l1