
Distribution of Sample Mean
Loading the math board and drawing, please wait…
In collections
Probability distributions with GeoGebra
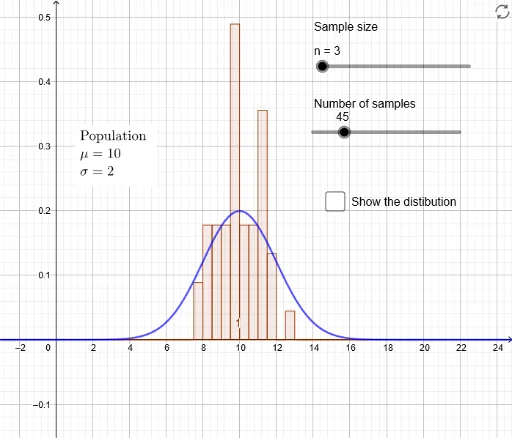
This example demonstrates the distribution of the sample mean. It involves core mathematical concepts such as Confidence Interval, Expected Value, Normal Distribution, Probability, Standard Deviation, Statistics, Binomial Distribution, Uniqueness, Error Bar, Coordinates, and Planar Shapes. The construction uses GeoGebra commands like Sequence, Normal, and Histogram, with objects including teksti1, n, teksti2, teksti3, a, l1, rajat, f, b, c, teksti4, g, d, teksti5. Suitable for high school students and beginners in statistics.
GeoGebra Commands & Parameters
Sequence(mean[Sequence[RandomNormal[10, 2], k, 1, n]], t, 1, a) → l1Sequence(k, k, 3, 17, 0.5) → rajatNormal(10, 2, x, false) → fHistogram(rajat, l1, true) → bHistogram(rajat, l1, true, 1 / a) → cNormal(10, 2 / sqrt(n), x, false) → g
AI Drawing Prompt Reference
Create a visualization showing the distribution of the sample mean, featuring normal distribution curves and histograms to illustrate mean distribution under varying sample sizes, with labeled expected values, standard deviations, and confidence intervals, using coordinate axes to depict data relationships, highlighting core statistical concepts.
The prompt above was compiled from the original drawing commands and is for reference only.