
Integrated Exploration of Binomial Distribution and Quadratic Roots (H2M L15 Q8)
Loading the math board and drawing, please wait…
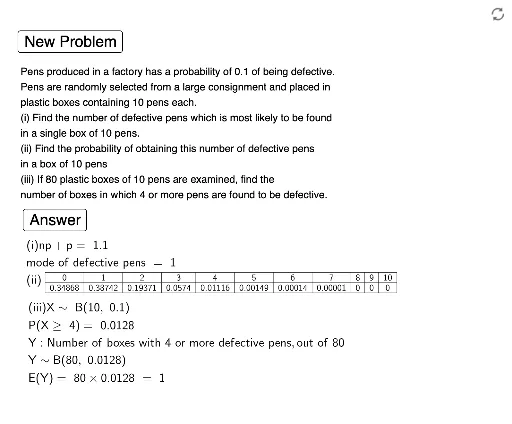
This GeoGebra example is a comprehensive interactive tool demonstrating the linkage between random binomial distribution generation, quadratic function graphs and their roots (zeros), while also touching on 3D vectors and arithmetic mean. Core mathematical concepts include binomial distribution, quadratic functions, roots, three-dimensional vectors, and arithmetic mean. Construction highlights: using GeoGebra commands such as Random, Sequence, TableText, and If; objects include buttons (button1, button2), sliders (n1, p1), lists (l1, l2), points (x1), and multiple text elements (text1 to text6) to create an interactive dynamic exploration. Suitable for high school or early college students to understand the connection between probability distributions and function graphs, and to discover mathematical patterns through dynamic manipulation.
GeoGebra Commands & Parameters
Random(6, 12) → n1Sequence(0, n1) → l1Sequence(BinomialDist[n1, p1, i, false], i, 0, n1) → l2Random(2, 4) → x1TableText(l1, l2, "c|_ ") → text2If(mo1 ≟ mo2, ((Text[mo1 - 1] * "\ and\ ") * Text[mo1]), (" " * mo2)) → text5