
Input and Output of Linear Functions: Interactive Graph Demo
Loading the math board and drawing, please wait…
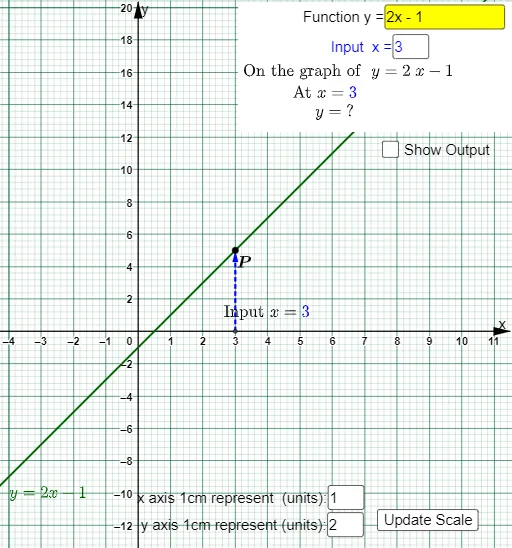
① This GeoGebra example demonstrates the relationship between the input (x-coordinate) and output (y-coordinate) of a linear function f(x)=mx+c through an interactive interface. Users can type an x-value into a text field and instantly see the corresponding point P on the graph, along with its coordinates and visual indicators. ② Core mathematical concepts include linear functions, slope and intercept, function mapping, coordinate geometry, and vector representation of differences. ③ Construction highlights: uses Textfield and InputBox for user input, Coefficients to extract function parameters, Point to define dynamic point P, Vector and Polygon to create auxiliary shapes (e.g., arrows or rectangles showing input-output differences), buttons (button1, button2) for toggling or resetting, and sliders/input boxes for adjusting axis units (xaxis1unit, yaxis1unit) and grid spacing (griddistancey). ④ Suitable for middle and high school students learning linear functions, function concepts, and graphing, as well as for teachers in classroom demonstrations or self-paced exploration to deepen understanding of dependent and independent variables.
GeoGebra Commands & Parameters
Textfield(f) → InputBox1Point(f) → PCoefficients(f) → L_1Element(L_1, 1) → mElement(L_1, 2) → cVector(P, P_y) → vVector(P, (x(P) - (sgnPx * i_x), y(P))) → aVector(P_x, P) → uVector(P_x, (x(P), (sgnPy * i_y))) → wTextfield(inputxcoord) → InputBox2Textfield(xaxis1unit) → InputBox3Textfield(yaxis1unit) → InputBox4Polygon(A, B, C, D) → q1, a_1, b, c_1, d
AI Drawing Prompt Reference
Draw a graph of a linear function with adjustable slope and intercept. Include a text input field where users can type an x-value, which generates a point on the function and displays its coordinates. From this point, draw perpendicular dashed lines to the x-axis and y-axis, with arrows indicating the horizontal and vertical differences. Add auxiliary rectangles or polygons to visually show the input-output mapping. Also include input boxes to adjust the unit lengths of the x-axis and y-axis, and a slider to control grid spacing. The layout should be clean and educational, emphasizing the relationship between independent and dependent variables.
The prompt above was compiled from the original drawing commands and is for reference only.