
Slope-Intercept Form Interactive Demo: Exploring Slope and Intercept
Loading the math board and drawing, please wait…
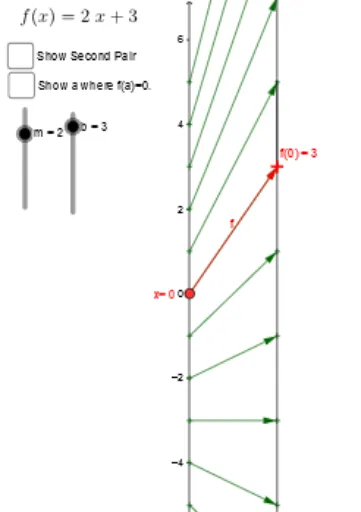
This GeoGebra example provides an interactive demonstration of the slope-intercept form of a linear equation, y = mx + b, showing how the slope m and the y-intercept b affect the position and direction of the line. The core mathematical concepts include linear functions, slope, y-intercept, and the geometric representation of lines in the Cartesian coordinate system. Construction highlights: using commands such as Point, Vector, Textfield, Segment, Sequence, and Zip to create dynamic points, vectors, text boxes, and segments, with sliders or input boxes to control parameters m and b, updating the line equation and graph in real time. Additional auxiliary points, rectangles, and proportional objects are constructed to help visualize how changing the slope alters the line's steepness and how changing the intercept shifts the line vertically. Suitable for middle school to high school students learning properties of linear functions, and useful for teacher demonstrations or student self-exploration to grasp the geometric meaning of parameters in the slope-intercept form.
GeoGebra Commands & Parameters
Point(yAxis) → AVector(A, B) → uTextfield(f) → inputBox1Vector(x_1, y_1) → vSegment(f_x, F) → cSegment(E, F) → dSegment(A, x_1) → eSegment(B, y_1) → gSegment(B, y_1) → hSequence(-5, 5) → NZip((0, k), k, N) → x_*Zip((2, f(k)), k, N) → y_*Zip(Vector[A, B], A, x_*, B, y_*) → arr_*Zip((y(A), y(B)), A, x_*, B, y_*) → Pt_*Vector(A_0, B_0) → wTextfield(a_0) → InputBox1
AI Drawing Prompt Reference
Draw a line in the Cartesian coordinate system to demonstrate how the slope m and y-intercept b in the linear equation y = mx + b affect the position and direction of the line. Use sliders to control the values of m and b, updating the line equation and graph in real time. Additionally, draw auxiliary points and rectangles to visualize how changes in the slope alter the steepness of the line and how changes in the intercept shift the line vertically.
The prompt above was compiled from the original drawing commands and is for reference only.