
Point-Slope Form Interactive Example (LF.Form.2)
Loading the math board and drawing, please wait…
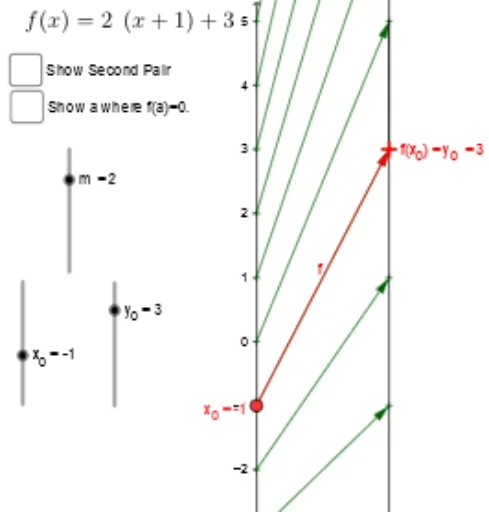
This GeoGebra example demonstrates the point-slope form of a linear equation, y - y₀ = m(x - x₀), through an interactive construction. The core mathematical concept is the point-slope representation of a line, emphasizing the roles of the slope m and the fixed point (x₀, y₀). The construction uses sliders or input boxes (inputBox1) to control m and the point coordinates, vectors (Vector) and segments (Segment) to build the direction vector and the line, sequences (Sequence) and zip (Zip) to generate dynamic point sets, and text (text4) to display the equation in real time. Suitable for high school coordinate geometry lessons, this example helps students visualize how changing the slope or the fixed point shifts the line, and how the point-slope form relates to other linear equation forms.
GeoGebra Commands & Parameters
Vector(A, B) → uTextfield(f) → inputBox1Vector(x_1, y_1) → vSegment(f_x, F) → cSegment(E, F) → dSegment(A, x_1) → eSegment(B, y_1) → gSegment(B, y_1) → hSequence(-5, 5) → NZip((0, k), k, N) → x_*Zip((2, f(k)), k, N) → y_*Zip(Vector[A, B], A, x_*, B, y_*) → arr_*Zip((y(A), y(B)), A, x_*, B, y_*) → Pt_*Vector(A_0, B_0) → wTextfield(a) → InputBox1Vector(A_0, B_0) → b
AI Drawing Prompt Reference
Draw a line using the point-slope form equation y - y₀ = m(x - x₀). Drag points A and B to change the line's position, and adjust the slope m in the input box to change the line's angle. Observe how the line changes with different points and slopes.
The prompt above was compiled from the original drawing commands and is for reference only.