
Induction and Inequalities
Loading the math board and drawing, please wait…
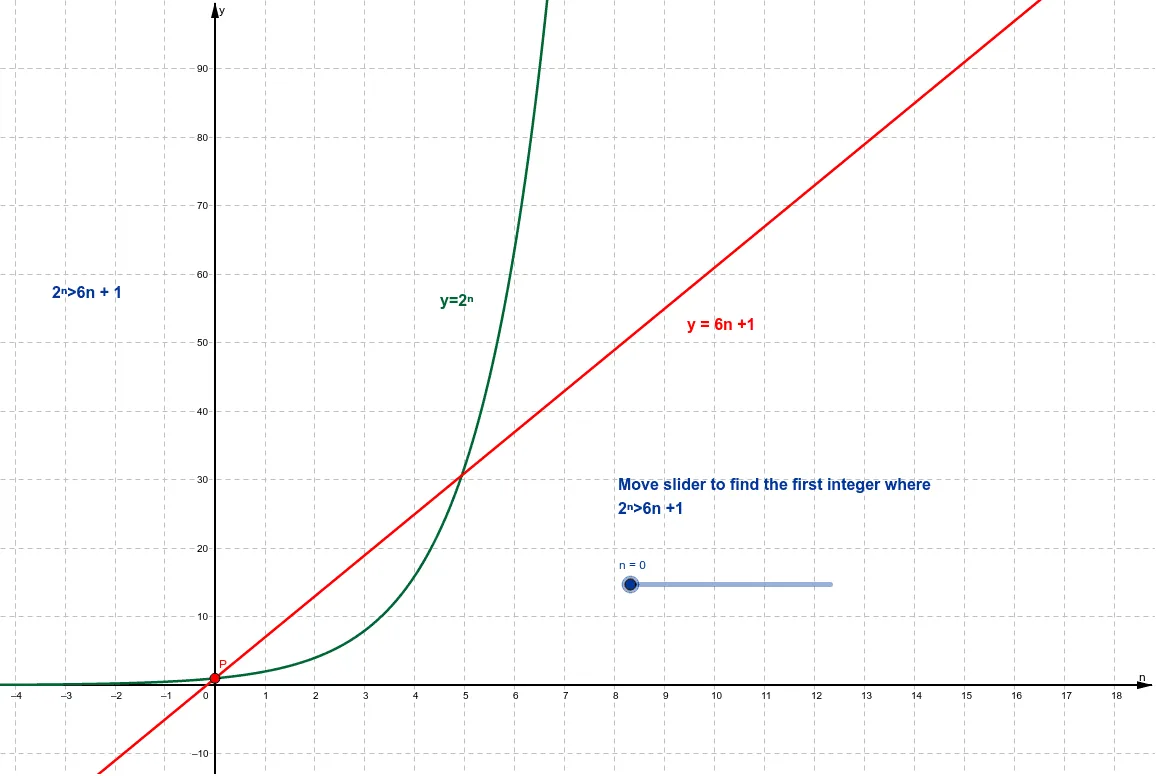
This example dynamically demonstrates the application of mathematical induction in inequality proofs, visually presenting the trend of inequality changes. It involves core mathematical concepts such as mathematical induction, inequality proofs, scatter plots, trigonometry, probability & statistics, and linear programming. Key GeoGebra commands/objects used include f (function), a (parameter), text1 to text4 (text annotations), n (variable), and P (probability point). Suitable for high school and above learners to understand the practical applications and visual representation of abstract mathematical concepts.
GeoGebra Commands & Parameters
f(x) = 2^(x)Line a(-6.0, 1.0, -1.0)Numeric n(0.0)(n, 2^(n))
AI Drawing Prompt Reference
Draw the graph of the exponential function y=2^x to show its trend as x changes. Use a reference line y=x-1 and set a variable parameter n on the x-axis to mark the point (n, 2^n). Add four text annotations to explain the concepts of mathematical induction, inequality proof, scatter plot, and probability point.
The prompt above was compiled from the original drawing commands and is for reference only.