
Illustrating Function Derivatives as Tangent-Line Slopes
Loading the math board and drawing, please wait…
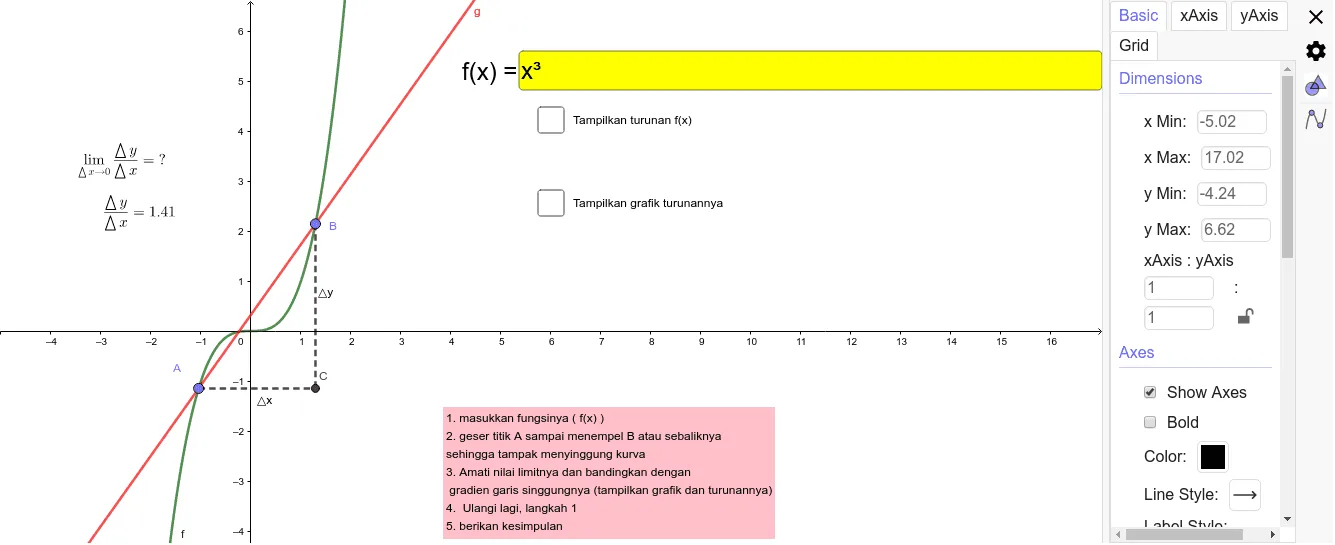
This example uses the tangent line to a function at a chosen point to visually demonstrate that the derivative equals the slope of the tangent line (local change rate). The key mathematics includes differentiation (Derivative), tangent construction (Tangent), slope (Slope), and the underlying idea of local behavior/limit (Limit) that motivates the derivative. In GeoGebra, the construction starts with Derivative to create the function’s derivative f', then places a point p on the graph, builds auxiliary lines with Line and OrthogonalLine, and uses Intersect to determine relevant intersection points. Tangent and Segment are used to display the tangent line and the important geometric segments, while Textfield annotates the computed slope/derivative value on the figure; InputBox1 and a limit-related workflow can be included to connect the numeric derivative with a limiting change-rate interpretation. It is designed for calculus instruction—especially for students learning derivatives visually via graphing and geometric reasoning.
GeoGebra Commands & Parameters
Derivative(f) → pPoint(f) → APoint(f) → BLine(A, B) → gOrthogonalLine(B, xAxis) → hOrthogonalLine(A, yAxis) → iIntersect(i, h) → CSegment(B, C) → jSegment(A, C) → kTangent(A, f) → lSlope(l) → bTextfield(f) → InputBox1Limit(p, x(A)) → cDerivative(f) → f'
AI Drawing Prompt Reference
Illustrate a function with its derivative curve, showing that the derivative equals the slope of the tangent line at a chosen point on the function. Start by plotting the derivative of the function, then mark a point on the function's graph. Draw a line through this point and another point on the function, and construct perpendicular lines from this point to the x-axis and y-axis. Connect the intersection of these lines to the point on the function. Next, draw the tangent line at the chosen point and display its slope, with a text label for the derivative value. Finally, incorporate a limit concept to connect the numerical derivative to the interpretation of local rate of change.
The prompt above was compiled from the original drawing commands and is for reference only.