
Identifying Outliers in Scatter Plots
Loading the math board and drawing, please wait…
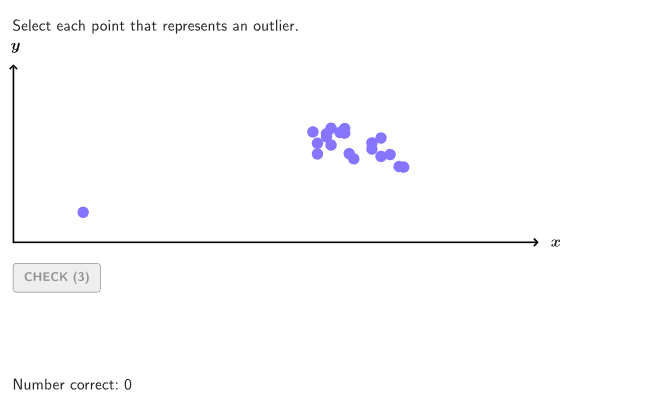
This activity demonstrates how to identify outliers in scatter plots. Students learn to recognize unusual data points that deviate significantly from the overall pattern, understand the impact of outliers on data analysis, and distinguish between outliers and data clusters. The construction uses GeoGebra commands including RandomUniform for generating random coordinates, Sequence and Zip for data sequence construction, Polygon and Segment for graphical elements, and Text for annotations. Suitable for grades 6-8, this resource helps students develop fundamental statistical reasoning skills and learn to analyze bivariate data effectively.
GeoGebra Commands & Parameters
RandomUniform(0, 0.99, 200) → allRandomSeeds, {0.7958563944291628, 0.3915624918818961, 0.2932294420836522, 0.7401431704012463, 0.5724260744306325, 0.4221525938901191, 0.34109160907200825, 0.1920062173159564, 0.06459378524871139, 0.6751254787774517, 0.32062091846183877, 0.5720348974994817, 0.22331925897635088, 0.096843629867881, 0.18811562796390063, 0.8203698204783221, 0.6687153478476997, 0.08261124973631181, 0.858568555031248, 0.20178749931964832, 0.874767751975692, 0.3752216590567491, 0.6502463678419537, 0.07006907993764211, 0.8881350399719284, 0.6877211873958065, 0.7660107840972353, 0.8597247594222645, 0.48882052213645943, 0.9845847202995538, 0.43172701145374964, 0.7749081018924836, 0.03272417760878359, 0.26326178391670785, 0.07228980774550432, 0.03983799795433378, 0.43173726117095146, 0.6167533302978182, 0.6344213618534845, 0.6154653387901594, 0.6561336846816218, 0.6275180858869077, 0.7324549204805334, 0.6234792288537817, 0.766542110089728, 0.823583044270964, 0.20881648558938223, 0.501042060352078, 0.1687490173529191, 0.4692472069838345, 0.15485300822112405, 0.7778757146537608, 0.8639873850970144, 0.7352180231402488, 0.8700271087595832, 0.10149074071876378, 0.7802076461902923, 0.7464089528112822, 0.05831069845703875, 0.7064577245020829, 0.7261068710146533, 0.9199531034376868, 0.5998565154992634, 0.8896653388235399, 0.6194083045386612, 0.5112508125444578, 0.0037127433237835526, 0.20549177676785033, 0.6440387996790884, 0.30207108796431986, 0.6434688791755673, 0.6727357478348958, 0.40744229203677385, 0.861864575705091, 0.6322816045965117, 0.829011828321198, 0.029297719810629987, 0.0015228640392135962, 0.6667271636389044, 0.4681084424090525, 0.9063759752366872, 0.3178316442985397, 0.3103627117189817, 0.9715401976612131, 0.4651751323890168, 0.4868172665175646, 0.5477518272262617, 0.27719584300321637, 0.27431458986255963, 0.8050742765065133, 0.8080200889537797, 0.1455905880889658, 0.4524487545051796, 0.4599880047523782, 0.7937546807712456, 0.15777624158916556, 0.7046767743342622, 0.12252997231276885, 0.2662472579581525, 0.2684455660584788, 0.26107990954340693, 0.20000478458426962, 0.7517028741538923, 0.4731865646071906, 0.3151096071688003, 0.47076617087072503, 0.4650977504439952, 0.9302003076969629, 0.897078545236155, 0.45849583389272625, 0.9588672224995374, 0.3940903854577935, 0.9489738507998193, 0.5001523888535302, 0.21254021836316322, 0.7125651825333108, 0.25121610767710517, 0.12914905868235727, 0.3868102079874485, 0.9060630714392015, 0.42982910804351204, 0.9537071392452489, 0.3813427049349712, 0.04541912757159863, 0.6337654114070467, 0.119658898092048, 0.369867698728792, 0.013736307778379982, 0.4268484536057839, 0.7672366049161309, 0.828790746785832, 0.3456060488252243, 0.5669475049998695, 0.3125862159416647, 0.526679639537814, 0.7497445253821092, 0.9465924165087093, 0.3368824433210023, 0.37154408442406855, 0.3699664321067477, 0.38426515170810605, 0.5089982898281532, 0.9408238814490792, 0.37421483323730037, 0.23407182419861483, 0.20169585156131414, 0.3454365259265787, 0.8620964665737362, 0.9434025041590448, 0.6562561985053055, 0.36410830891567497, 0.6780431959932847, 0.30352933258129783, 0.4663550099872679, 0.6475237779407599, 0.1098266489195119, 0.7468708655756197, 0.8588166464308096, 0.2535756306952432, 0.3506986715614222, 0.7468692928921373, 0.5966431442216774, 0.175183988032395, 0.8979123118545231, 0.9720799911198285, 0.9284155925995324, 0.940775587674635, 0.910798117341396, 0.34516547722753954, 0.4578044491752583, 0.9545753182858937, 0.08792799313471682, 0.440014843961109, 0.4675007741791743, 0.23935939358061237, 0.5251934528243069, 0.5161766455688401, 0.7433950042938801, 0.6482558916496483, 0.6148580961587056, 0.419197340804247, 0.7272802044003266, 0.0945510069298192, 0.7798135700107173, 0.9182994835011812, 0.19974578346205316, 0.9492699809923367, 0.79737581002263, 0.7991128170773751, 0.8192540671404379, 0.3955497920028327, 0.23300344408647305, 0.54888848777437, 0.16865511746150427, 0.21650598151695236, 0.25630259990909265, 0.10478084240361232, 0.9065971245340948, 0.8994195876317771, 0.30960207110173954}If(maxRandIndex > numRandoms, Take[allRandomSeeds, maxRandIndex - numRandoms, maxRandIndex], Take[allRandomSeeds, 1, numRandoms]) → currentRandomSeedsIf(regSlope < 0, 8.5, If[regSlope > 0, 1.5, 2]) → regInterceptInsert((0.5 * 20 / divisorY), Sequence[floor(((currentRandomSeeds(numPoints - numOutliers + 1 + k) - 0.5) * 20)) / divisorY, k, 1, numPoints - 1], 10) → randomListYKeepIf(x > 0, randomListY) → posYIndexOf((0.5 * 20 / divisorY), randomListY) → onboardingIndexIf(currentRandomSeeds(1) > 0.5, true, false) → isClusterIf(isCluster, round((currentRandomSeeds(1) * 7) + 1), 5) → clusterLocationIf(isCluster, 11, 3) → divisorXIf(isCluster, Sequence[clusterLocation + round(((currentRandomSeeds(k + 1) - 0.5) * 25)) / divisorX, k, 1, numPoints], Sequence[((k + ((-1)^(k + 1) * currentRandomSeeds(k + 1))) * (maxX - 1) / numPoints), k, 1, numPoints]) → randomListXSequence((Element[randomListX, k], (regSlope * Element[randomListX, k]) + regIntercept + Element[randomListY, k]), k, 1, numPoints) → pointsListIf(abs(abs(regSlope) - 0.5) ≤ 0.1, (regSlope * (-1 / 2)), If[regSlope ≠ 0, (regSlope * (-1)), 0.3]) → outlierSlopeSequence(currentRandomSeeds(k) / 2 + k, k, 1, 9) → outlierX, {1.3979281972145814, 2.1957812459409483, 3.1466147210418263, 4.370071585200623, 5.286213037215316, 6.21107629694506, 7.170545804536004, 8.096003108657978, 9.032296892624355}Zip((k, (outlierSlope * k) + outlierIntercept), k, outlierX) → outlierOptionsKeepIf(Distance[A, ClosestPoint[pointsList, A]] > outlierMin, A, outlierOptions) → outlierPointsElement(outlierPoints, Length[outlierPoints]) → Outlier2Element(outlierPoints, 1) → Outlier1Element({{Outlier1}, {Outlier1, Outlier2}}, numOutliers) → allOutliersJoin({pointsList, allOutliers}) → allPointsTake(inputCurrent, 1, numPoints) → clusterBooleanListTake(inputCurrent, numPoints + 1, numPoints + numOutliers) → outlierBooleanListCorner(5) → layoutAppSizePolygon({(-0.5, -0.5), (-0.5, maxY + 0.5), (maxX + 0.5, maxY + 0.5), (maxX + 0.5, -0.5)}) → viewboxElement(pointsList, 1) → point1Element(pointsList, 2) → point2Element(pointsList, 3) → point3Element(pointsList, 4) → point4Element(pointsList, 5) → point5Element(pointsList, 6) → point6Element(pointsList, 7) → point7Element(pointsList, 8) → point8Element(pointsList, 9) → point9Element(pointsList, 10) → point10Element(pointsList, 11) → point11Element(pointsList, 12) → point12Element(pointsList, 13) → point13Element(pointsList, 14) → point14Element(pointsList, 15) → point15Element(pointsList, 16) → point16Element(pointsList, 18) → point18Element(pointsList, 19) → point19Element(pointsList, 17) → point17Segment((0, 0), (0, maxY + 0.5)) → yAxisLineSegment((0, 0), (maxX + 0.5, 0)) → xAxisLineText("y", (0.05, maxY + 0.6), true, true, 0, 1) → lblYPolygon({(-0.5, -0.5), (-0.5, maxY), (maxX, maxY), (maxX, -0.5)}) → ShadedBoxRemoveUndefined(Sequence[If[clusterBooleanList(A), allPoints(A)], A, 1, numPoints]) → selectedClusterPointsRemoveUndefined(Sequence[If[outlierBooleanList(A), allOutliers(A)], A, 1, numOutliers]) → selectedOutliersJoin({selectedClusterPoints, selectedOutliers}) → allSelectedPointsText("x", (maxX + 0.6, 0.1), true, true, 1, 0) → lblX
AI Drawing Prompt Reference
Draw a scatter plot with randomly generated data points and possible outlier points. Include axes and grid lines for reference. The construction order is: first generate random coordinates, identify outliers that deviate from the overall trend, then plot all points on the coordinate system, marking outliers differently.
The prompt above was compiled from the original drawing commands and is for reference only.