
Identifying Flaws in Scatter Diagrams – Interactive Applet
Loading the math board and drawing, please wait…
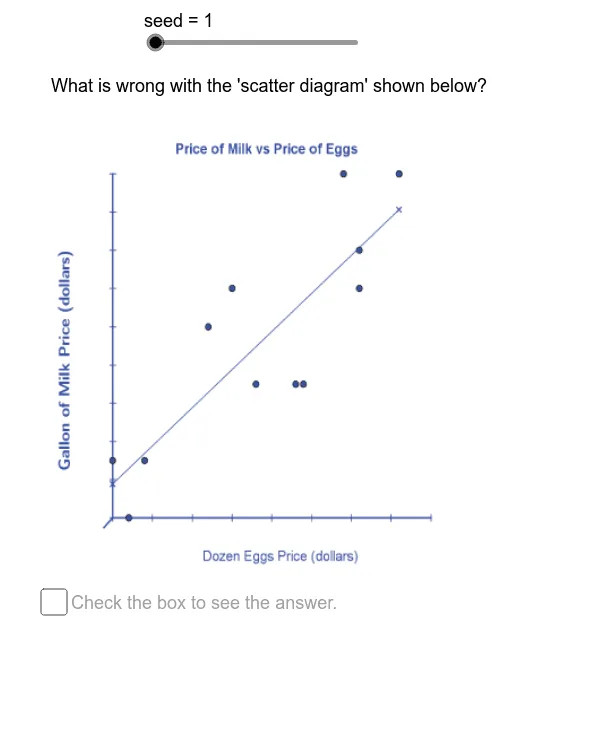
This GeoGebra applet presents students with a series of intentionally flawed scatter diagrams and prompts them to identify what is wrong with each plot. It focuses on statistical concepts such as data visualization, correlation vs. causation, misleading axes, outliers, and inappropriate scaling. The construction uses the Element command to access random seeds and problem statements, defines multiple scatter plot point sets (SP1 through SP12), and incorporates interactive answer components (An01–An12) with a final summary object (Answr). Suitable for middle school through introductory statistics courses, this resource helps develop critical thinking and graph literacy skills through hands-on exploration and immediate feedback.
GeoGebra Commands & Parameters
Element(AnSq, seed) → Answr