
Hypothesis Testing & Limit Functions Demo
Loading the math board and drawing, please wait…
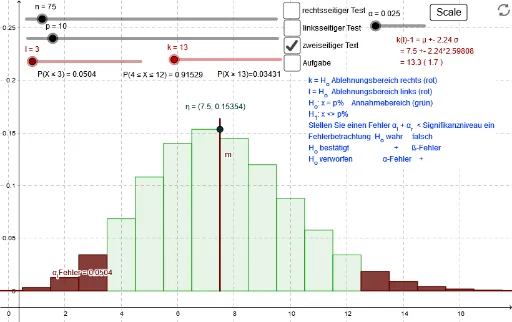
This example demonstrates the geometric interpretation of hypothesis testing and limit functions through dynamic graphics; involves core math concepts like limits, exponential functions, translation, and rational numbers; constructed using GeoGebra commands such as Sequence, BarChart, Max, Segment, Element; suitable for high school and above mathematics education, illustrating the integration of probability statistics and calculus.
GeoGebra Commands & Parameters
Sequence(i, i, 0, n) → XSequence(((Binomial[n, i] * (p / 100)^(i)) * (1 - p / 100)^(n - i)), i, 0, n) → YBarChart(X, Y) → PMax(Y) → m_ySequence(Element[Y, i], i, k + 1, n + 1) → Alpha_1Sequence(Element[X, i], i, k + 1, n + 1) → Alpha_xBarChart(Alpha_x, Alpha_1) → α_rFehlerSegment((m_x, m_y + 0.01), (m_x, 0)) → mSequence(Element[X, i], i, 1, l + 1) → Alpha_lSequence(Element[Y, i], i, 1, l + 1) → Alpha_yBarChart(Alpha_l, Alpha_y) → α_lFehlerElement(Y, l + 1) → B_l
AI Drawing Prompt Reference
Create a dynamic graphic demonstrating the geometric interpretation of hypothesis testing and limit functions. Generate a sequence X from 0 to n, then calculate sequence Y based on the binomial distribution and probability p, visualized as a bar chart P. Identify the maximum value m_y in Y, extract parts of X and Y from k+1 to n+1 for a bar chart α_rFehler. Draw a line segment from (m_x, m_y+0.01) to (m_x, 0). Extract parts of X and Y from 1 to l+1 for a bar chart α_lFehler and mark the value at position l+1 in Y as B_l.
The prompt above was compiled from the original drawing commands and is for reference only.