
Hypothesis Testing Example: Page 103, Example 4
Loading the math board and drawing, please wait…
In collections
AS Statistics
This example demonstrates the hypothesis testing process on page 103, example 4. The core mathematical concepts include the principles and steps of hypothesis testing. Using GeoGebra commands such as RotateText, Sequence, Min, and Max, a dynamic demonstration of hypothesis testing is constructed. Suitable for statistics education and learning.
GeoGebra Commands & Parameters
RotateText("y", 0) → text3RotateText("x", 0) → text4Sequence(Segment[(-100, i), (100, i)], i, -50, 50, 0.1) → list1Sequence(Segment[(-100, i), (100, i)], i, -50, 50, 0.5) → list2Sequence(Segment[(i, -100), (i, 100)], i, -50, 50, 0.1) → list3Sequence(Segment[(i, -100), (i, 100)], i, -50, 50, 0.5) → list4Sequence(40, 40, 0, 40) →Min(x(Point[xAxis]) + 1.5, x(Point[xAxis]) + 1.5) →Max(x(Point[xAxis]) + 1.5, x(Point[xAxis]) + 1.5) →
AI Drawing Prompt Reference
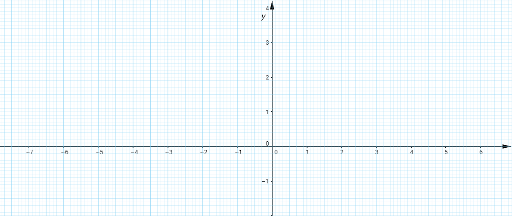
Create a dynamic visualization of hypothesis testing, featuring a grid of thin horizontal and vertical line segments, with two bold horizontal and vertical segments. The grid lines range from -100 to 100, drawn at steps of 0.1 and 0.5, while the bold lines are spaced at 40 units. Label the x and y axes, and display a numerical sequence ranging from -100 to 100.
The prompt above was compiled from the original drawing commands and is for reference only.